By Franck Pachot
.
I’ll present How to read an AWR report next month at UKOUG TECH15 and the first recommendation after checking Average Active Sessions is to verify that we are not in a CPU starvation situation. Here is a little demo to show how it looks like in an AWR report.
In other words, I’ll demo the second line of:
Slide 21 provides an excellent summary!https://t.co/jn64Sp8Plv pic.twitter.com/AQgq3cCMkh
— Chris Antognini (@ChrisAntognini) November 3, 2015
One session 100% in CPU
I’m doing the demo on a VM with 4 cores and I’m running a query that reads 15 million blocks from buffer cache, which means it run fully in CPU for nearly 5 minutes:
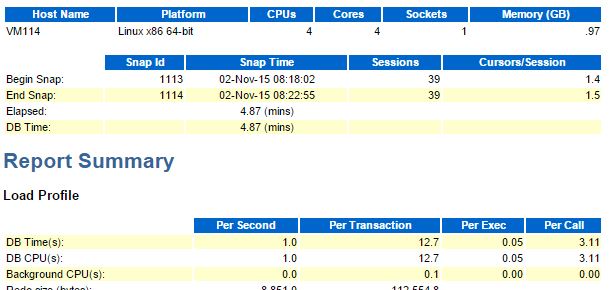
From the load profile above we are actually using 1 second of CPU per second, which confirms that my session was able to run in CPU 100% of the time.
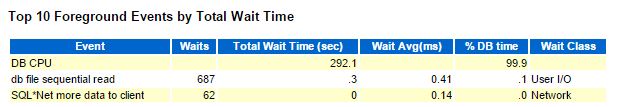
It’s the only activity in that database, so I see nearly 100% of the DB time spent in CPU:
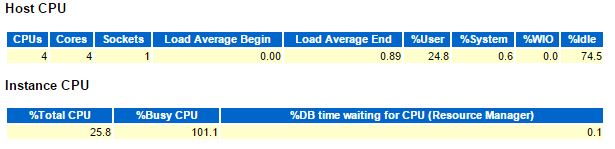
From the host, it’s the only instance running there, using 1 of the 4 vCPU – which means 25% utilization:
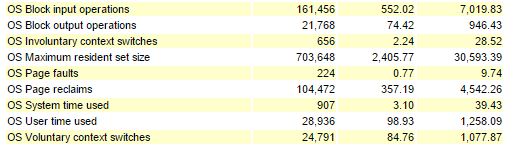
I’ve set timed_os_statistics to gather OS statistics every 10 seconds. We can see that most context switches are voluntary ones (when doing a system call):
Finally I check ASH:
29 samples (taken every 10 seconds) are in CPU or Wait for CPU which covers nearly 100% of the 292.1 seconds of DB CPU.
This is the ‘normal’ case.
One session 100% + four processes in CPU
Now, in addition to my Oracle session I run 4 processes that also want to run on CPU all the time:
dd if=/dev/random of=/dev/null&
dd if=/dev/random of=/dev/null&
dd if=/dev/random of=/dev/null&
dd if=/dev/random of=/dev/null&
I introduced contention on the server, thus the time to run the same workload in the database has increased:
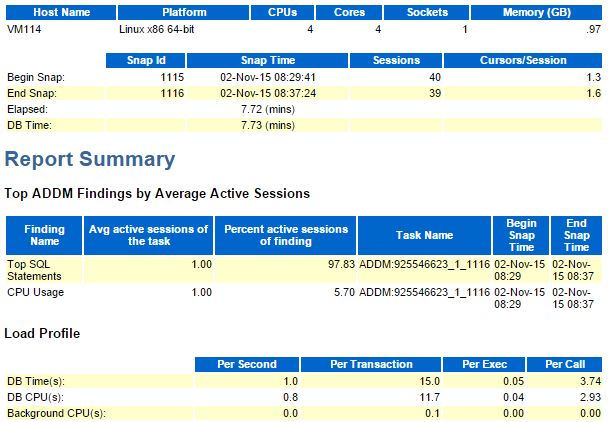
You see here that DB time has increased because it includes the time to wait for CPU in runqueue, but the DB CPU(s) per second is now only 0.8 because my session was about 20% of its time waiting for CPU (5 processes sharing only 4 vCPUs).
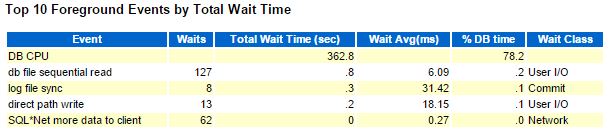
The main symptom of that is on the Top events where the total is far less than 100% because of the unaccounted time waiting in runqueue:
Look at the load average that is higher than the number of vCPUs:
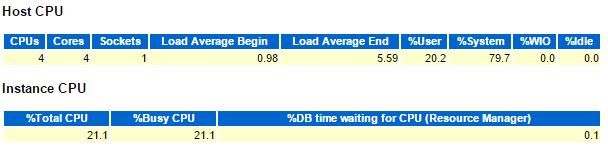
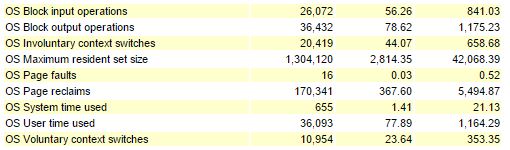
Lot of time in context switching (system CPU) and my instance is using only 1/5 of the total CPU used.
The OS has to share the cpu among the processes. this is why we see more ‘involuntary context switches’ than voluntary ones:
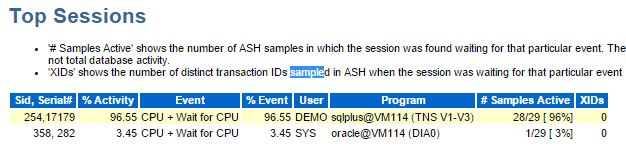
Now comparing with ASH:
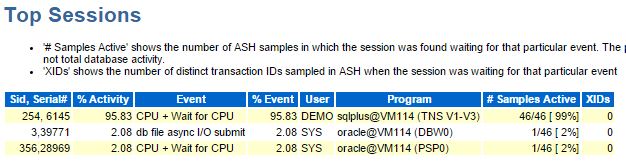
460 seconds (46 samples taken every 10 seconds) in CPU is far more than the DB CPU (362.8) because 20% of the time was spent waiting for CPU, because of involuntary context switches, because of CPU starvation.
Note that the time waiting in runqueue after a wait event (system call – voluntary context switch) is not accounted as ‘Wait for CPU’ but is accounted in the wait event waiting time, for the simple reason that the accounting (which is done by a few CPU instructions) can’t be done before the process is back in CPU. A consequence of that is inflated wait time. I don’t have lot of waits here, but you can see that ‘db file sequential read’ is on average less than one millisecond in the first case, but has been inflated to 6 milliseconds when CPU had to be shared by lot of processes.
I usually don’t look at ADDM report, but there is a little clue about that in it – unfortunately not the Top-1 finding:
Finding 2: CPU Usage
Impact is .06 active sessions, 5.7% of total activity.
------------------------------------------------------
Host CPU was a bottleneck and the instance was consuming 26% of the host CPU.
All wait times will be inflated by wait for CPU.
Host CPU consumption was 100%.

   Recommendation 1: Application Analysis
   Estimated benefit is 1 active sessions, 100% of total activity.
...
   Recommendation 2: Host Configuration
   Estimated benefit is .06 active sessions, 5.7% of total activity.
...
The recommendations are not good either. My problem is on the host, outside of this database instance. It’s the rare case where we have to check at system level before looking at application…
Conclusion: if you are CPU-bound, the most important numbers in the AWR report (wait events) are meaningless. I wanted to show that kind of report here. At TECH15 presentation I just warn about it and then show how I read a report that is relevant. Hope to see you there.
![Thumbnail [60x60]](https://www.dbi-services.com/blog/wp-content/uploads/2022/12/oracle-square.png)
![Thumbnail [90x90]](https://www.dbi-services.com/blog/wp-content/uploads/2022/08/DWE_web-min-scaled.jpg)
![Thumbnail [90x90]](https://www.dbi-services.com/blog/wp-content/uploads/2022/08/JDU_web-min-scaled.jpg)