By Franck Pachot
.
The Exadata X5 can be installed Bare Metal or Virtualized. The latter one, Oracle VM allows to create multiple clusters on one machine, is more complex for installation and for storage capacity planning. But it allows a small flexibility on options licencing. Those are the real challenges behind the choice. However, when we talk about virtualization, most of questions are about the overhead. Last week, we did some tests on same machine with different configuration, thanks to Arrow Oracle Authorized Solution Center.
Comparison is not easy. Bare Metal has all resources. Virtualized has to distribute resources. And this test is very specific: all I/O hitting the ‘extreme’ flash cache because I don’t expect any virtualization overhead to be in milliseconds. So, don’t expect some universal conclusions from those tests. And don’t hesitate to comment about my way to read those numbers.
CPU
Do not expect a benchmark that shows the maximum capacity of the machine here. I’m comparing a bare metal node with 36 cores with a VM with 4 vCPUS. So I’ll compare a one thread workload only: SLOB with one session and SCALE=100M UPDATE_PCT=0 RUN_TIME=120 WORK_UNIT=64
Bare Metal load profile:
Load Profile                    Per Second   Per Transaction  Per Exec  Per Call
~~~~~~~~~~~~~~~            ---------------   --------------- --------- ---------
             DB Time(s):               1.0              30.5      0.00      2.91
              DB CPU(s):               1.0              29.0      0.00      2.76
      Background CPU(s):               0.0               0.2      0.00      0.00
      Redo size (bytes):          14,172.4         432,594.0
  Logical read (blocks):         810,244.4      24,731,696.3
          Block changes:              41.7           1,271.3
 Physical read (blocks):             111.6           3,407.8
Physical write (blocks):               0.0               0.3
       Read IO requests:             111.3           3,397.3
      Write IO requests:               0.0               0.3
           Read IO (MB):               0.9              26.6
          Write IO (MB):               0.0               0.0
         Executes (SQL):          12,285.1         374,988.5
Virtualized load profile:
Load Profile                    Per Second   Per Transaction  Per Exec  Per Call
~~~~~~~~~~~~~~~            ---------------   --------------- --------- ---------
             DB Time(s):               1.0              30.6      0.00      4.37
              DB CPU(s):               1.0              29.8      0.00      4.26
      Background CPU(s):               0.0               0.2      0.00      0.00
      Redo size (bytes):          13,316.5         410,404.0
  Logical read (blocks):         848,095.1      26,137,653.8
          Block changes:              41.1           1,266.3
 Physical read (blocks):             109.1           3,361.3
Physical write (blocks):               0.0               0.3
       Read IO requests:             103.8           3,198.5
      Write IO requests:               0.0               0.3
           Read IO (MB):               0.9              26.3
          Write IO (MB):               0.0               0.0
         Executes (SQL):          13,051.2         402,228.0
We can say that CPU and RAM performance is similar.
I/O
Now about IOPS on the storage cell flash cache.
I’ll compare SLOB with one session and SCALE=100000M UPDATE_PCT=100 RUN_TIME=120 WORK_UNIT=64
Bare Metal load profile:
Load Profile                    Per Second   Per Transaction  Per Exec  Per Call
~~~~~~~~~~~~~~~            ---------------   --------------- --------- ---------
             DB Time(s):               1.0               0.0      0.02      4.06
              DB CPU(s):               0.1               0.0      0.00      0.49
      Background CPU(s):               0.1               0.0      0.00      0.00
      Redo size (bytes):       1,652,624.9          51,700.6
  Logical read (blocks):           2,582.2              80.8
          Block changes:           4,214.5             131.9
 Physical read (blocks):           2,060.6              64.5
Physical write (blocks):           1,818.0              56.9
       Read IO requests:           2,051.0              64.2
      Write IO requests:           1,738.6              54.4
           Read IO (MB):              16.1               0.5
          Write IO (MB):              14.2               0.4
         Executes (SQL):              66.3               2.1
              Rollbacks:               0.0               0.0
           Transactions:              32.0
Virtualized load profile:
Load Profile                    Per Second   Per Transaction  Per Exec  Per Call
~~~~~~~~~~~~~~~            ---------------   --------------- --------- ---------
             DB Time(s):               1.0               0.0      0.01      3.49
              DB CPU(s):               0.3               0.0      0.00      1.01
      Background CPU(s):               0.2               0.0      0.00      0.00
      Redo size (bytes):       2,796,963.3          51,713.3
  Logical read (blocks):           4,226.0              78.1
          Block changes:           7,107.0             131.4
 Physical read (blocks):           3,470.6              64.2
Physical write (blocks):           3,278.7              60.6
       Read IO requests:           3,462.0              64.0
      Write IO requests:           3,132.0              57.9
           Read IO (MB):              27.1               0.5
          Write IO (MB):              25.6               0.5
         Executes (SQL):              86.9               1.6
              Rollbacks:               0.0               0.0
           Transactions:              54.1
In two minutes we did more work here. Timed events show statistics about the ‘cell single block reads’ which are nothing else than ‘db file sequential read’ renamed to look more ‘Exadata’. No SmartScan happens here as they go to buffer cache and we cannot do any filtering for blocks that will be shared with other sessions.
Bare Metal:
                                           Total Wait       Wait   % DB Wait
Event                                Waits Time (sec)    Avg(ms)   time Class
------------------------------ ----------- ---------- ---------- ------ --------
cell single block physical rea     249,854      115.7       0.46   94.9 User I/O
DB CPU                                           14.6              12.0
Virtualized: Total Wait Wait % DB Wait
Event                                Waits Time (sec)    Avg(ms)   time Class
------------------------------ ----------- ---------- ---------- ------ --------
cell single block physical rea     425,071      109.3       0.26   89.4 User I/O
DB CPU                                           35.2              28.8
Lower latency here on average which explains why we did more work. But no conclusion before we know where the latency comes from. Averages hides the details, and it’s the same with the ‘IO Profile’ section:
Bare Metal
IO Profile                  Read+Write/Second     Read/Second    Write/Second
~~~~~~~~~~                  ----------------- --------------- ---------------
            Total Requests:           3,826.6         2,055.1         1,771.5
         Database Requests:           3,789.5         2,051.0         1,738.6
        Optimized Requests:           3,720.7         1,985.1         1,735.6
             Redo Requests:              32.5             0.0            32.5
                Total (MB):              32.0            16.2            15.9
             Database (MB):              30.3            16.1            14.2
      Optimized Total (MB):              29.3            15.6            13.7
                 Redo (MB):               1.7             0.0             1.7
         Database (blocks):           3,878.6         2,060.6         1,818.0
 Via Buffer Cache (blocks):           3,878.6         2,060.6         1,818.0
           Direct (blocks):               0.0             0.0             0.0
Virtualized
IO Profile                  Read+Write/Second     Read/Second    Write/Second
~~~~~~~~~~                  ----------------- --------------- ---------------
            Total Requests:           6,652.2         3,467.0         3,185.2
         Database Requests:           6,594.0         3,462.0         3,132.0
        Optimized Requests:           6,582.7         3,461.2         3,121.5
             Redo Requests:              54.7             0.0            54.7
                Total (MB):              55.6            27.2            28.4
             Database (MB):              52.7            27.1            25.6
      Optimized Total (MB):              51.8            27.1            24.6
                 Redo (MB):               2.8             0.0             2.8
         Database (blocks):           6,749.3         3,470.6         3,278.7
 Via Buffer Cache (blocks):           6,749.3         3,470.6         3,278.7
           Direct (blocks):               0.0             0.0             0.0
and for IO statistics.
Bare Metal:
                 Reads:  Reqs    Data   Writes:  Reqs    Data    Waits:   Avg
Function Name      Data per sec per sec    Data per sec per sec   Count  Tm(ms)
--------------- ------- ------- ------- ------- ------- ------- ------- -------
Buffer Cache Re    1.9G  2050.9 16.093M      0M     0.0      0M  250.2K     0.5
DBWR                 0M     0.0      0M    1.7G  1740.5 14.216M       0     N/A
LGWR                 0M     0.0      0M    201M    32.5  1.648M    3914     0.3
Others               8M     4.1   .066M      1M     0.5   .008M     560     0.0
TOTAL:             1.9G  2055.0 16.159M    1.9G  1773.4 15.872M  254.6K     0.5
Virtualized:
                 Reads:  Reqs    Data   Writes:  Reqs    Data    Waits:   Avg
Function Name      Data per sec per sec    Data per sec per sec   Count  Tm(ms)
--------------- ------- ------- ------- ------- ------- ------- ------- -------
Buffer Cache Re    3.3G  3462.7  27.12M      0M     0.0      0M  425.6K     0.3
DBWR                 0M     0.0      0M    3.1G  3133.9 25.639M       0     N/A
LGWR                 0M     0.0      0M    341M    54.7  2.775M    6665     0.3
Others              10M     5.0   .081M      1M     0.5   .008M     514     0.3
TOTAL:             3.3G  3467.7 27.202M    3.4G  3189.0 28.422M  432.7K     0.3
I’ve put the physical read statistics side-by-side to compare:
                                 BARE METAL                        VIRTUALIZED

Statistic                                     Total     per Trans              Total     per Trans
-------------------------------- ------------------ ------------- ------------------ -------------
cell flash cache read hits                  242,142          62.1            425,365          64.0
cell logical write IO requests                5,032           1.3              8,351           1.3
cell overwrites in flash cache              200,897          51.5            937,973         141.1
cell physical IO interconnect by      8,145,832,448   2,089,210.7     14,331,230,720   2,156,044.9
cell writes to flash cache                  638,514         163.8          1,149,990         173.0
physical read IO requests                   250,168          64.2            425,473          64.0
physical read bytes                   2,059,042,816     528,095.1      3,494,084,608     525,663.4
physical read partial requests                    4           0.0                  0           0.0
physical read requests optimized            242,136          62.1            425,365          64.0
physical read total IO requests             250,671          64.3            426,089          64.1
physical read total bytes             2,067,243,008     530,198.3      3,504,136,192     527,175.6
physical read total bytes optimi      1,993,089,024     511,179.5      3,497,918,464     526,240.2
physical read total multi block                   0           0.0                  0           0.0
physical reads                              251,348          64.5            426,524          64.2
physical reads cache                        251,348          64.5            426,524          64.2
physical reads cache prefetch                 1,180           0.3              1,051           0.2
physical reads direct                             0           0.0                  0           0.0
physical reads direct (lob)                       0           0.0                  0           0.0
physical reads prefetch warmup                1,165           0.3              1,016           0.2
physical write IO requests                  212,061          54.4            384,909          57.9
physical write bytes                  1,816,551,424     465,901.9      3,300,933,632     496,605.0
physical write requests optimize            211,699          54.3            383,624          57.7
physical write total IO requests            216,077          55.4            391,445          58.9
physical write total bytes            2,026,819,072     519,830.5      3,656,793,600     550,142.0
physical write total bytes optim      1,755,620,352     450,274.5      3,171,875,328     477,189.0
physical write total multi block                531           0.1                942           0.1
physical writes                             221,747          56.9            402,946          60.6
physical writes direct                            0           0.0                  0           0.0
physical writes direct (lob)                      0           0.0                  0           0.0
physical writes from cache                  221,747          56.9            402,946          60.6
physical writes non checkpoint              221,694          56.9            402,922          60.6
We already know that there were more work on the OVM run but comparing the ‘per transaction’ statistics show similar things but a bit more ‘flash cache’ ‘optimized’ I/O in the second run.
Of course, even if it’s the same machine, it has been re-imaged, database re-created, different volume and capacity. So maybe I hit more the cell flash on the second run than on the first one and more reads on spinning disks can explain the difference on single block reads latency.
We need to get beyond the averages with the wait event histograms. They don’t show lower than millisecond in the AWR report (I’ve opened an enhancement request for 12.2 about that) but I collected them from the V$EVENT_HISTOGRAM_MICRO
Bare Metal:
EVENT                                    WAIT_TIME_MICRO WAIT_COUNT WAIT_TIME_FORMAT
---------------------------------------- --------------- ---------- ------------------------------
cell single block physical read                        1          0 1 microsecond
cell single block physical read                        2          0 2 microseconds
cell single block physical read                        4          0 4 microseconds
cell single block physical read                        8          0 8 microseconds
cell single block physical read                       16          0 16 microseconds
cell single block physical read                       32          0 32 microseconds
cell single block physical read                       64          0 64 microseconds
cell single block physical read                      128        533 128 microseconds
cell single block physical read                      256     240142 256 microseconds
cell single block physical read                      512       7818 512 microseconds
cell single block physical read                     1024        949 1 millisecond
cell single block physical read                     2048        491 2 milliseconds
cell single block physical read                     4096       1885 4 milliseconds
cell single block physical read                     8192       3681 8 milliseconds
cell single block physical read                    16384       2562 16 milliseconds
cell single block physical read                    32768        257 32 milliseconds
cell single block physical read                    65536         52 65 milliseconds
cell single block physical read                   131072          3 131 milliseconds
cell single block physical read                   262144          0 262 milliseconds
cell single block physical read                   524288          1 524 milliseconds
Virtualized:
EVENT                                    WAIT_TIME_MICRO WAIT_COUNT WAIT_TIME_FORMAT
---------------------------------------- --------------- ---------- ------------------------------
cell single block physical read                        1          0 1 microsecond
cell single block physical read                        2          0 2 microseconds
cell single block physical read                        4          0 4 microseconds
cell single block physical read                        8          0 8 microseconds
cell single block physical read                       16          0 16 microseconds
cell single block physical read                       32          0 32 microseconds
cell single block physical read                       64          0 64 microseconds
cell single block physical read                      128          1 128 microseconds
cell single block physical read                      256     322113 256 microseconds
cell single block physical read                      512     105055 512 microseconds
cell single block physical read                     1024       1822 1 millisecond
cell single block physical read                     2048        813 2 milliseconds
cell single block physical read                     4096        681 4 milliseconds
cell single block physical read                     8192        283 8 milliseconds
cell single block physical read                    16384        231 16 milliseconds
cell single block physical read                    32768         64 32 milliseconds
cell single block physical read                    65536         11 65 milliseconds
cell single block physical read                   131072          3 131 milliseconds
In the first run we see more reads around 8ms which confirms the previous guess that we had more flash cache hit on the second run.
The waits between 128 and 512 milliseconds are from the cell flash storage and this is where I want to see if virtualization has an overhead.
I’ve put it in color there where it’s easier to visualize that most of the reads are in the 128-256 range. Bare Metal in blue, OVM in orange.
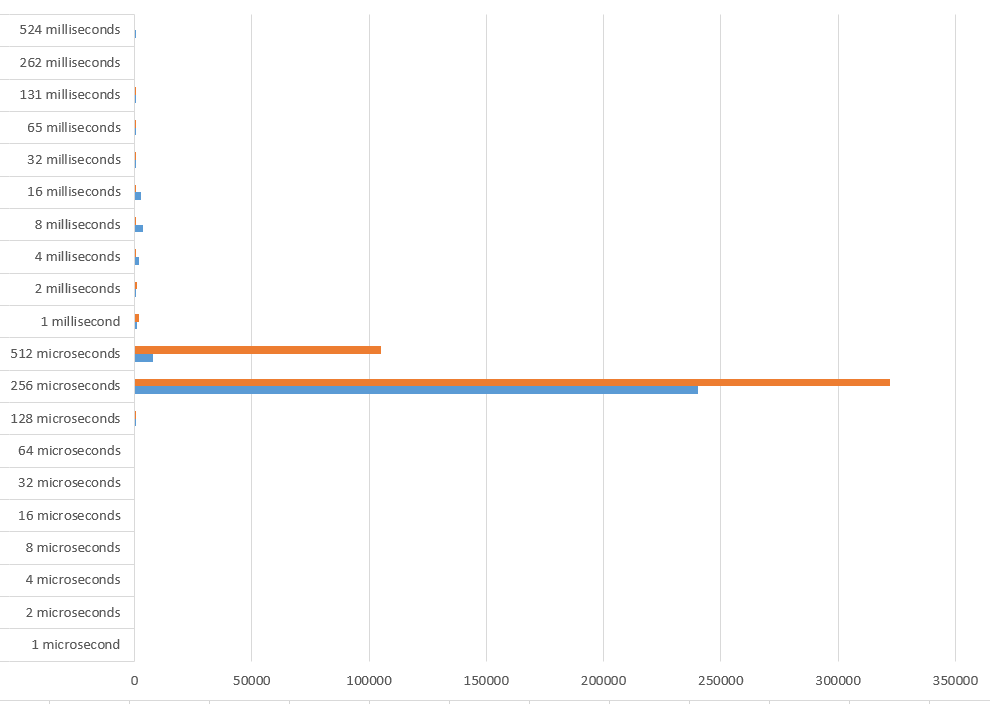
In Bare Metal, most of the reads are faster than 256 microseconds. In virtualized there are some significant reads are above. This may be cause by virtualization but anyway that’s not a big difference. I don’t think that virtualization overhead is an important criteria when choosing how to install your Exadata. Storage capacity planning is the major criteria: consolidate all storage in two diskgroups (DATA and RECO) for all databases, or partition them for each cluster. choice is about manageability and agility in provisioning vs. licence optimization.
![Thumbnail [60x60]](https://www.dbi-services.com/blog/wp-content/uploads/2022/12/oracle-square.png)
![Thumbnail [90x90]](https://www.dbi-services.com/blog/wp-content/uploads/2022/08/DWE_web-min-scaled.jpg)