In this blog, I will give you some best practices and tricks when you are loading table to generate your data. But before, I will review the different ways to load data in a QlikView or QlikSense report.
1.How to retrieve data in QlikView
You have 2 different possibilities to load your data in your report:
- Database connector
- File connector
a) Database connector:
If your data are located in a database, you must use this kind of connectors.
To connect to a database:
Open “Script Editor”
Click on “Tab” and “Add Tab…”
Give a name to the new Tab and clock “OK”
Select the data source
Select your connection (for OLE DB, ODBC, connections should be created in the ODBC administrator tool from windows)
Remark: You can use a special connection on the ETL tool from QlikView named QlikView Expressor
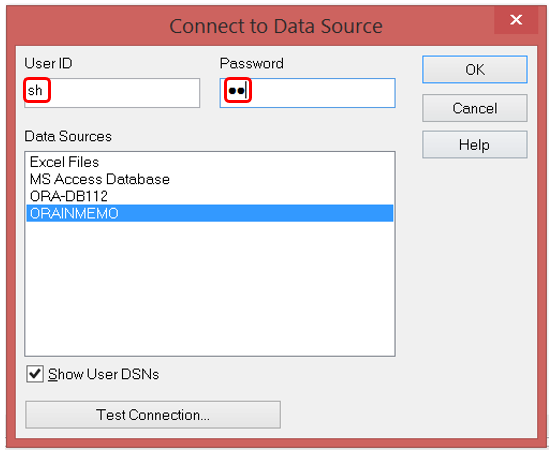
For this example, I want to connect on a Oracle database:
Select the connection and click “OK”
Select a table (1), than select the fields you want see in your report (2) and click “OK” (3)
TRICK 1: If you use the “Connect” option and you add the User ID and the password in the connection interface, they will be put in the SQL script in an encrypted format
b) Data file:
You have 4 different options:
(1) Table Files: you can select the following kind of files
(2) QlikView File: You can load .qvw file (QlikView file)
(3) Web File: You can load a file coming from a website
(4) Field data: you can load specific rows coming from a field located in a database
In this example, we select a .qvd file using the 1 option (table file)
You have 2 options:
Click “Next” and “Next”: you access to the column choose interface
Remark: To remove a column, click on the cross. Then click “Next ”
Check the SQL. If it’s ok, click on “Finish”
Click on “Reload” to load the data
Best Practices: create a variable path
If you must load data coming from files located in a specific repository, and if this repository is going to change after the report is published in different environments, it is recommended to create a variable to define the folder path.
Go on the Main Tab and create the variable “FilePath”. Don’t forget the “;” at the end
On the other tab where you load data coming from file located in the same folder, add the variable before the name of the file.
After the deployment on other environment, you just have to update the variable and of course, reload the data.
2.Optimize the data recovery in QlikView / QlickSence
In this example, some tables are loaded just for one field. We can optimize this schema with using a mapping function. The goal is to limit the number of tables used directly in the schema.
Warning: The mapping function can only be used to add one field in a table.
In our example, we want to add the filed “Product Group desc” in the table “ITEM_MATSER”.
To create a mapping tab:
Add a new Tab just after the main tab
Use the function “MAPPING” in the script as follow:
In the destination table, add the field with the following function “Applymap” as follow:
(1) Put the name of the Mapping table you have created
(2) Put the name of the key field
(3) Put the name of the field you want to show in your table
Don’t forget to comment the script from your mapped table.
After refreshing the data, you will see that the table has disappeared and the filed has been added in the main table.
3.How to add a Master Calendar table
You can generate automatically a master calendar if you need to have all the days located in a period. This calendar will be generated in 3 different steps:
a) Creation of the Min / Max date temporary table.
Create a new tab and add the following script:
b) Creation date temporary table.
Add the following script to create a temporary table with all the dates between the MIN and MAX date you have define using the function “AUTOGENERATE”
Note that we drop the result from the MIN / MAX table at the end of the creation from the temporary table.
c) Creation Master Calendar table.
After the generation from the temporary table, add the following script to create all the different date fields you need (Year, month, week …)
Remark: to join your tables, you must give to your new generated field the same name than the field you have used to create your calendar. The result should be like this.
I hope that these best pratices and tricks will help you !


![Thumbnail [60x60]](https://www.dbi-services.com/blog/wp-content/uploads/2022/08/ALA_web-min-scaled.jpg)
![Thumbnail [90x90]](https://www.dbi-services.com/blog/wp-content/uploads/2022/08/GME_web-min-scaled.jpg)
![Thumbnail [90x90]](https://www.dbi-services.com/blog/wp-content/uploads/2022/08/MOP_web-min-scaled.jpg)
![Thumbnail [90x90]](https://www.dbi-services.com/blog/wp-content/uploads/2022/08/ATR_web-min-scaled.jpg)
![Thumbnail [90x90]](https://www.dbi-services.com/blog/wp-content/uploads/2022/08/CVI_web-min-scaled.jpg)