By Franck Pachot
.
In the last post I published the strange results I had when testing physical I/O with the latest Spectre and Meltdown patches. There is the logical I/O with SLOB cached reads.
Logical reads
I’ve run some SLOB cache reads with the latest patches, as well as with only KPTI disabled, and with KPTI, IBRS and IBPB disabled.
I am on the Oracle Public Cloud DBaaS with 4 OCPU
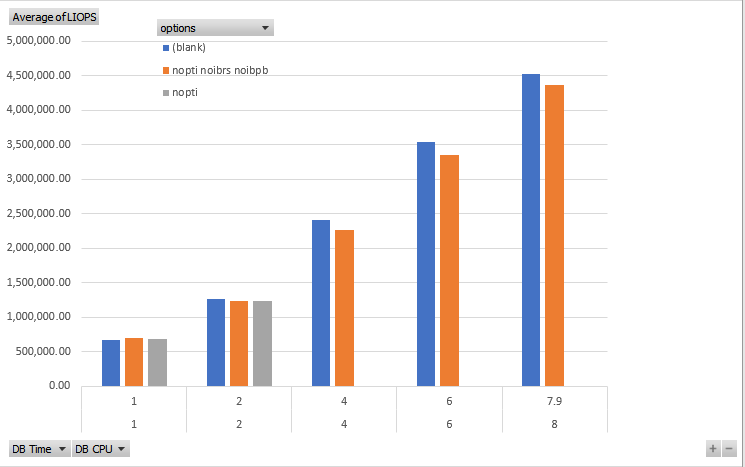
DB Time(s) :  1.0    DB CPU(s) :  1.0    Logical read (blocks) :    670,001.2
DB Time(s) :  1.0    DB CPU(s) :  1.0    Logical read (blocks) :    671,145.4
DB Time(s) :  1.0    DB CPU(s) :  1.0    Logical read (blocks) :    672,464.0
DB Time(s) :  1.0    DB CPU(s) :  1.0    Logical read (blocks) :    685,706.7     nopti
DB Time(s) :  1.0    DB CPU(s) :  1.0    Logical read (blocks) :    689,291.3     nopti
DB Time(s) :  1.0    DB CPU(s) :  1.0    Logical read (blocks) :    689,386.4     nopti
DB Time(s) :  1.0    DB CPU(s) :  1.0    Logical read (blocks) :    699,301.3     nopti noibrs noibpb
DB Time(s) :  1.0    DB CPU(s) :  1.0    Logical read (blocks) :    704,773.3     nopti noibrs noibpb
DB Time(s) :  1.0    DB CPU(s) :  1.0    Logical read (blocks) :    704,908.2     nopti noibrs noibpb
This is what I expected: when disabling the mitigation for Meltdown (PTI), and for some of the Spectre (IBRS and IBPB), I have a slightly better performance – about 5%. This is with only one SLOB session.
However, with 2 sessions I have something completely different:
DB Time(s) :  2.0    DB CPU(s) :  2.0    Logical read (blocks) :  1,235,637.8     nopti noibrs noibpb
DB Time(s) :  2.0    DB CPU(s) :  2.0    Logical read (blocks) :  1,237,689.6     nopti
DB Time(s) :  2.0    DB CPU(s) :  2.0    Logical read (blocks) :  1,243,464.3     nopti noibrs noibpb
DB Time(s) :  2.0    DB CPU(s) :  2.0    Logical read (blocks) :  1,247,257.4     nopti
DB Time(s) :  2.0    DB CPU(s) :  2.0    Logical read (blocks) :  1,247,257.4     nopti noibrs noibpb
DB Time(s) :  2.0    DB CPU(s) :  2.0    Logical read (blocks) :  1,251,485.1
DB Time(s) :  2.0    DB CPU(s) :  2.0    Logical read (blocks) :  1,253,477.0
DB Time(s) :  2.0    DB CPU(s) :  2.0    Logical read (blocks) :  1,271,986.7
This is not a saturation situation here. My VM shape is 4 OCPUs, which is supposed to be the equivalent of 4 hyperthreaded cores.
And this figure is even worse with 4 sessions (all cores used) and more:
DB Time(s) :  4.0    DB CPU(s) :  4.0    Logical read (blocks) :  2,268,272.3     nopti noibrs noibpb
DB Time(s) :  4.0    DB CPU(s) :  4.0    Logical read (blocks):   2,415,044.8
DB Time(s) :  6.0    DB CPU(s) :  6.0    Logical read (blocks) :  3,353,985.7     nopti noibrs noibpb
DB Time(s) :  6.0    DB CPU(s) :  6.0    Logical read (blocks):   3,540,736.5
DB Time(s) :  8.0    DB CPU(s) :  7.9    Logical read (blocks) :  4,365,752.3     nopti noibrs noibpb
DB Time(s) :  8.0    DB CPU(s) :  7.9    Logical read (blocks):   4,519,340.7
The graph from those is here:
If I compare with the Oracle PaaS I tested last year (https://www.dbi-services.com/blog/oracle-public-cloud-liops-with-4-ocpu-in-paas/) which was on Intel(R) Xeon(R) CPU E5-2690 v2 @ 3.00GHz you can also see a nice improvement here on Intel(R) Xeon(R) CPU E5-2699C v4 @ 2.20GHz.
This test was on 4.1.12-112.14.10.el7uek.x86_64 and Oracle Linux has now released a new update: 4.1.12-112.14.11.el7uek
![Thumbnail [60x60]](https://www.dbi-services.com/blog/wp-content/uploads/2022/12/oracle-square.png)
![Thumbnail [90x90]](https://www.dbi-services.com/blog/wp-content/uploads/2022/08/ENB_web-min-scaled.jpg)
![Thumbnail [90x90]](https://www.dbi-services.com/blog/wp-content/uploads/2022/08/JDU_web-min-scaled.jpg)
![Thumbnail [90x90]](https://www.dbi-services.com/blog/wp-content/uploads/2022/08/ALN_web-min-scaled.jpg)