By Franck Pachot
.
The Spectre and Meltdown is now in the latest Oracle UEK kernel, after updating it with ‘yum update’:
[opc@PTI ~]$ rpm -q --changelog kernel-uek
             | awk '/CVE-2017-5715|CVE-2017-5753|CVE-2017-5754/{print $NF}' | sort | uniq -c
     43 {CVE-2017-5715}
     16 {CVE-2017-5753}
     71 {CVE-2017-5754}
As I did on the previous post on AWS, I’ve run quick tests on the Oracle Public Cloud.
Physical reads
I’ve run some SLOB I/O reads with the patches, as well sit KPTI disabled, and with KPTI, IBRS and IBPB disabled.
And I was quite surprised by the result:
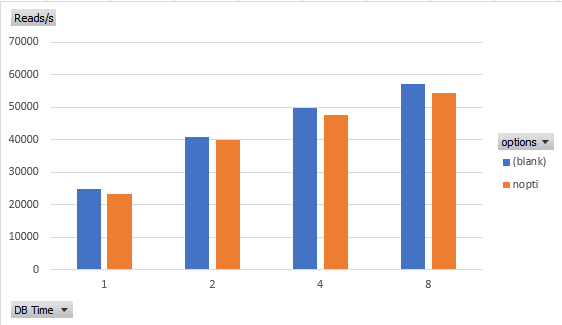
DB Time(s) :  1.0    DB CPU(s) :  0.4  Read IO requests :   23,335.6   nopti
DB Time(s) :  1.0    DB CPU(s) :  0.4  Read IO requests :   23,420.3   nopti
DB Time(s) :  1.0    DB CPU(s) :  0.4  Read IO requests :   24,857.6
DB Time(s) :  1.0    DB CPU(s) :  0.4  Read IO requests :   25,332.1
DB Time(s) :  2.0    DB CPU(s) :  0.7  Read IO requests :   39,857.7   nopti
DB Time(s) :  2.0    DB CPU(s) :  0.7  Read IO requests :   40,088.4   nopti
DB Time(s) :  2.0    DB CPU(s) :  0.7  Read IO requests :   40,627.0
DB Time(s) :  2.0    DB CPU(s) :  0.7  Read IO requests :   40,707.5
DB Time(s) :  4.0    DB CPU(s) :  0.9  Read IO requests :   47,491.4   nopti
DB Time(s) :  4.0    DB CPU(s) :  0.9  Read IO requests :   47,491.4   nopti
DB Time(s) :  4.0    DB CPU(s) :  0.9  Read IO requests :   49,438.2
DB Time(s) :  4.0    DB CPU(s) :  0.9  Read IO requests :   49,764.5
DB Time(s) :  8.0    DB CPU(s) :  1.2  Read IO requests :   54,227.9   nopti
DB Time(s) :  8.0    DB CPU(s) :  1.2  Read IO requests :   54,582.9   nopti
DB Time(s) :  8.0    DB CPU(s) :  1.3  Read IO requests :   57,288.6
DB Time(s) :  8.0    DB CPU(s) :  1.4  Read IO requests :   57,057.2
Yes. I all tests that I’ve done, the IOPS is higher with KPTI enabled vs. when booting the kernel with the nopti option. Here is a graph with those numbers:
I did those tests on the Oracle Cloud because I know that we have very fast I/O here, in hundreds of microseconds, probably all cached in the storage:
Top 10 Foreground Events by Total Wait Time
~~~~~~~~~~~~~~~~~~~~~~~~~~~~~~~~~~~~~~~~~~~
                                           Total Wait       Avg   % DB Wait
Event                                Waits Time (sec)      Wait   time Class
------------------------------ ----------- ---------- --------- ------ --------
db file parallel read              196,921      288.8    1.47ms   48.0 User I/O
db file sequential read            581,073      216.3  372.31us   36.0 User I/O
DB CPU                                          210.5             35.0

                                                 % of Total Waits
                                 -----------------------------------------------                             Waits
                           Total                                                                              1ms
Event                      Waits  <8us <16us <32us <64us <128u <256u =512  Event                     to 32m  <512  <1ms  <2ms  <4ms  <8ms <16ms =32m
------------------------- ------ ----- ----- ----- ----- ----- ----- ----- -----  ------------------------- ------ ----- ----- ----- ----- ----- ----- ----- -----
db file parallel read     196.9K                                  .0   1.0  99.0  db file parallel read     194.9K   1.0  15.4  74.7   8.5    .3    .1    .0    .0
db file sequential read   581.2K                                17.3  69.5  13.3  db file sequential read    77.2K  86.7  10.7   2.3    .2    .1    .0    .0    .0
So what?
I expected to have higher IOPS when disabling the page table isolation, because of the overhead of context switches. And it is the opposite here. Maybe this is because I have a very small SGA (because my goal is to have only physical reads). Note also that, as far as I know, only my guest OS has been patched for Meltdown and Spectre. We will see if the numbers are different after the next Oracle Cloud maintenance.
![Thumbnail [60x60]](https://www.dbi-services.com/blog/wp-content/uploads/2022/12/oracle-square.png)
![Thumbnail [90x90]](https://www.dbi-services.com/blog/wp-content/uploads/2022/08/ENB_web-min-scaled.jpg)
![Thumbnail [90x90]](https://www.dbi-services.com/blog/wp-content/uploads/2022/08/JDU_web-min-scaled.jpg)
![Thumbnail [90x90]](https://www.dbi-services.com/blog/wp-content/uploads/2022/08/ALN_web-min-scaled.jpg)