By Franck Pachot
.
In a previous post, I have described Adaptive Plans. Even if I prefer to show plans with the SQL Monitor active html format, I had to stick with the dbms_xplan for that because SQL Monitoring did not show all information about adaptive plans.
This has been fixed in the Patchset 1 and I have run the same query to show the new feature.
First, an adaptive plan can be in two states: ‘resolving’ where all alternatives are possible and ‘resolved’ then the final plan has been choosen. It is resolved once the first execution statistics collector has made the decision about the inflection point. We can see the state in the SQL Monitor header:
Here my plan is resolved because the first execution is finished.
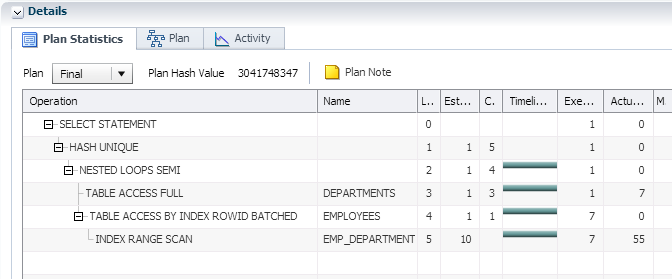
The plan with rowsource statistics show only the current plan, but the ‘Plan Note’ shows that it is an adaptive plan:
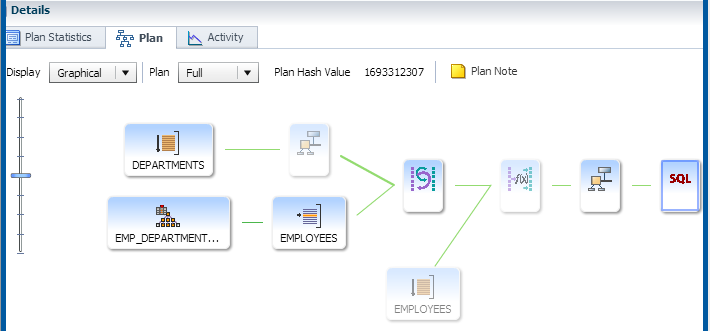
Now we have to go to the ‘Plan’ tab which show the equivalent of dbms_xplan.display_cursor:
Here the format is equivalent to format=>’adaptive’. It’s the ‘Full’ plan where all branches are shown but inactive part is grayed. We have here the Statistics Collector after reading DEPARTMENTS, and we have the inactive full table scan hash join of EMPLOYEES.
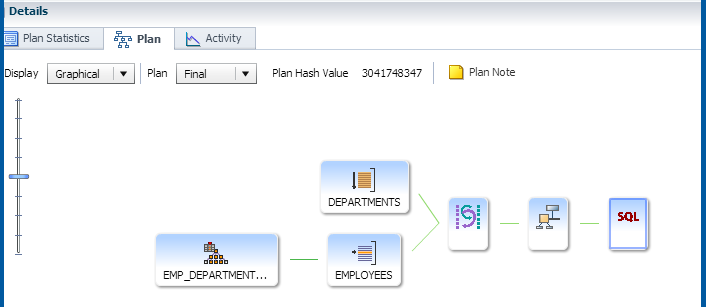
Just choose the ‘Final’ Plan (or ‘Current’ if it is not yet resolved) to get only the active part:
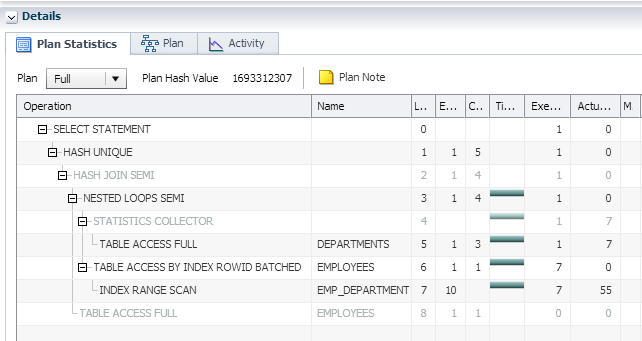
I often prefer the tabular format to the graphical one:
We have all information: the 7 rows from DEPARTMENTS have gone through STATISTICS COLLECTOR and NESTED LOOP with index access has been choosen. Note that it is different from the previous post where HASH JOIN with full table scan was choosen because the 7 rows were higher than the inflection point.
In my current example, because I have system statistics that costs full table scan higher:
DP: Found point of inflection for NLJ vs. HJ: card = 8.35
This is higher than ny 7 rows from DEPARTMENTS.
Here is the whole sqlmon report: sqlmon.zip and how I got it:
alter session set current_schema=HR;
 select /*+ monitor */ distinct DEPARTMENT_NAME from DEPARTMENTS
 join EMPLOYEES using(DEPARTMENT_ID)
 where DEPARTMENT_NAME like '%ing' and SALARY>20000;
alter session set events='emx_control compress_xml=none';set pagesize 0 linesize 10000 trimspool on serveroutput off long 100000000 longc 100000000 echo off feedback off
 spool sqlmon.htm
 select dbms_sqltune.report_sql_monitor(report_level=>'all',type=>'html') from dual;
 spool off
Note that I used the script exposed here and I used the emx_event to get the uncompressed xml, which I got from Tyler Muth:
@FranckPachot well, I asked @DBAKevlar, she asked the developer that owns it 😉
— tmuth (@tmuth) July 25, 2014


![Thumbnail [60x60]](https://www.dbi-services.com/blog/wp-content/uploads/2022/12/oracle-square.png)
![Thumbnail [90x90]](https://www.dbi-services.com/blog/wp-content/uploads/2022/08/DWE_web-min-scaled.jpg)
![Thumbnail [90x90]](https://www.dbi-services.com/blog/wp-content/uploads/2022/08/JDU_web-min-scaled.jpg)
yong321
02.10.2023Hi. The link in "In a previous post, I have described Adaptive Plans" is broken. Could you fix it? Thank you!
You don't have to show my comment. I just want to inform you of the error.
Clemens Bleile
06.10.2023Hi,
thanks for the info. I fixed it.
Regards
Clemens