The last posts looked at how the logging system and the pg_stat_statements extension can be used to monitor sql statements in PostgreSQL. This post will introduce pg_activity which is very similar to htop.
There are some dependencies which need to be installed before we can start installing pg_activity. The first one is python. As I am on a redhat based distribution this is quite easy:
1 | [root@oel7 ~] yum install -y python |
Then we need to install psycopg which is the database adapter for PostgreSQL for the python language (Note: if you have installed PostgreSQL not in the default location edit the setup.cfg script and provide the path to pg_config. Otherwise the install will fail):
1 2 3 4 | postgres@oel7:/var/tmp/ [dummy] tar -axf psycopg2-2.6.1.tar.gzpostgres@oel7:/var/tmp/ [dummy] cd psycopg2-2.6.1postgres@oel7:/var/tmp/psycopg2-2.6.1/ [dummy] python setup.py buildpostgres@oel7:/var/tmp/psycopg2-2.6.1/ [dummy] sudo python setup.py install |
The next (and last) thing we need to have available is psutils, a python library for querying os statistics:
1 2 3 | postgres@oel7:/var/tmp/ [dummy] tar -axf psutil-3.3.0.tar.gzpostgres@oel7:/var/tmp/ [dummy] cd psutil-3.3.0postgres@oel7:/var/tmp/ [dummy] sudo python setup.py install |
That’s it. Now we can install pg_activity:
1 2 3 | postgres@oel7:/var/tmp/ [dummy] unzip pg_activity-master.zippostgres@oel7:/var/tmp/ [dummy] cd pg_activity-masterpostgres@oel7:/var/tmp/ [dummy] sudo python setup.py install |
Quite easy. Lets see what we can do with it. If you are locally on the server where your PostgreSQL instance runs you can just start pg_activity (I fired a sql statement so that you can see at least one sql in the screenshot):
1 | postgres@oel7:/home/postgres/ [PG3] pg_activity |
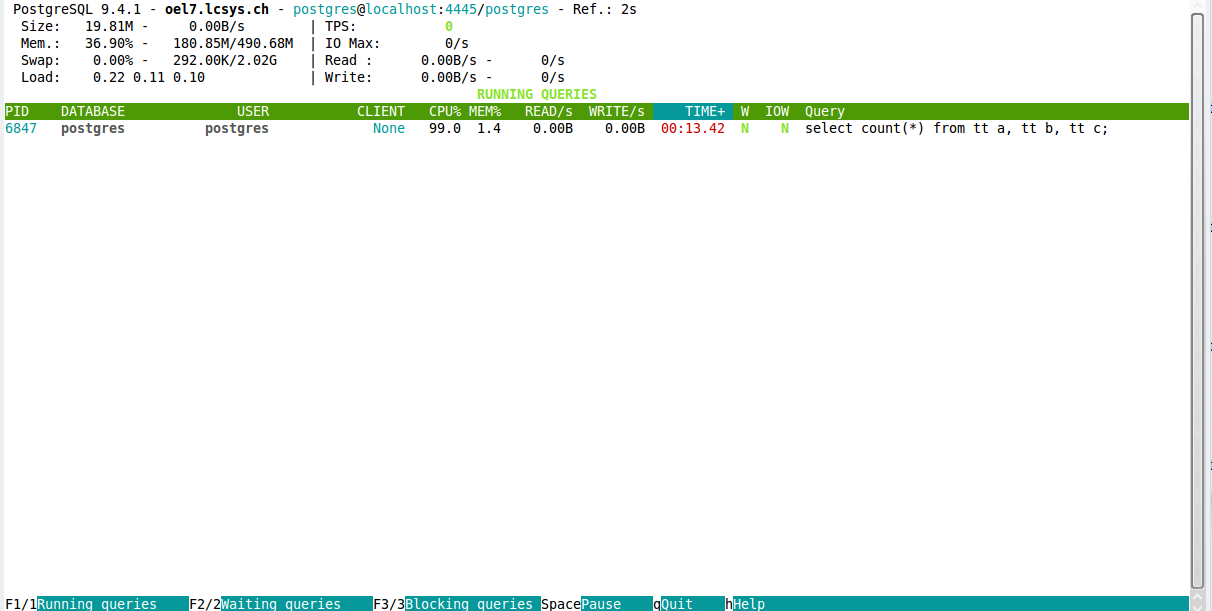
There is a nice summary on the top like in top/htop. The different statements which are currently executing are displayed below.
Hitting “h” for help shows you the various options:
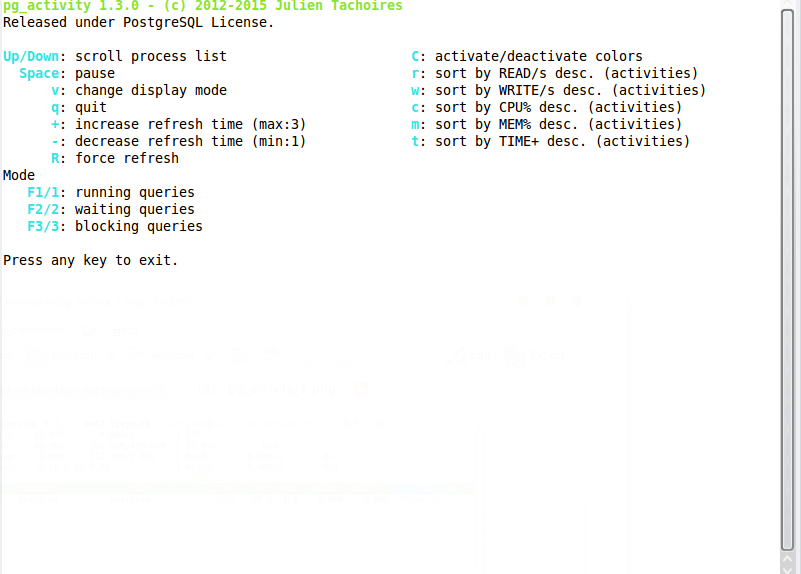
The “F1/2/3” switches are very nice when you want to display blocking queries only, running queries only or waiting queries only. Another great features is that you do not need to install pg_activity on the server where PostgreSQL is running. The same connections options as in e.g. psql are there so that you can connect to any remote PostgreSQL instance you have access to:
1 2 3 4 5 6 7 8 9 10 11 12 13 14 15 16 17 18 19 20 21 22 23 24 25 26 27 28 29 30 31 32 | postgres@oel7:/home/postgres/ [PG3] pg_activity --helpUsage: pg_activity [options]htop like application for PostgreSQL server activity monitoring.Options: --version show program's version number and exit -U USERNAME, --username=USERNAME Database user name (default: "postgres"). -p PORT, --port=PORT Database server port (default: "5432"). -h HOSTNAME, --host=HOSTNAME Database server host or socket directory (default: "localhost"). -d DBNAME, --dbname=DBNAME Database name to connect to (default: "postgres"). -C, --no-color Disable color usage. --blocksize=BLOCKSIZE Filesystem blocksize (default: 4096) --rds Enable support for AWS RDS --help Show this help message and exit. --debug Enable debug mode for traceback tracking. Display Options, you can exclude some columns by using them : --no-database Disable DATABASE. --no-user Disable USER. --no-client Disable CLIENT. --no-cpu Disable CPU%. --no-mem Disable MEM%. --no-read Disable READ/s. --no-write Disable WRITE/s. --no-time Disable TIME+. --no-wait Disable W. |
Conclusion: pg_activity is small but very useful tool for monitoring an PostgreSQL instance. In the next posts I’ll look into some more feature rich monitoring solutions that are around for monitoring PostgreSQL instances.
![Thumbnail [60x60]](https://www.dbi-services.com/blog/wp-content/uploads/2022/08/DWE_web-min-scaled.jpg)
