As promised in my latest blog, I will talk about improvements in the detection of the availability group replication latency. As a reminder, replication latency between high available replicas may be monitored in different manners so far.
Firstly, in my experience I had the opportunity to use different performance counters as “Database Replica:Transaction Delay” and “Databas Replica:Mirrored Write Transactions/sec” in order to get a good picture of the latency over the time after implementing an availability group. I have also experienced performance issues at customer places where referring to the HADR_SYNC_COMMIT wait type was also very valuable. However, in both cases experiencing high transaction delay means only that the primary is waiting on response from remote replica that the log block has been hardened. This is a relevant information for sure but this is only the symptom. Indeed, at this point we are not aware of where the issue is occurring exactly and we have to figure out what the root cause of this latency is. Is the network involved or maybe log flushing activity on the secondary or both? Well, it is sure that further investigations will be necessary to locate and get rid of the root cause.
When I discovered the new diagnostic features from recent service packs of SQL Server, I enjoyed to see that new extended events were added and will allow to respond easier to the previous request. Before going further to the new extended events study, let’s say that I learned a lot by attending to the very interesting web meeting about AlwaysOn troubleshooting improvements given by Amit Banerjee (Senior PM Microsoft for Tiger Team). During this web meeting, he provided a lot of useful information about new ways to diagnostic AlwaysOn architectures including the new extended events.
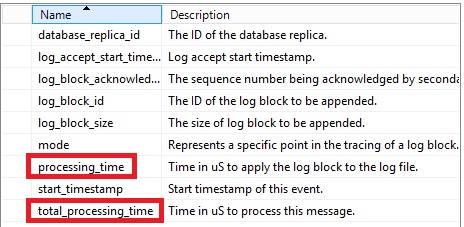
You may find out an exhaustive list of new / enhanced extended events and their corresponding performance counters by referring to the Microsoft KB3173156 but let me summarize the main benefit we may get. Well, we have now a complete picture of the replication stack and processing time value at each level of the architecture as you may see below:
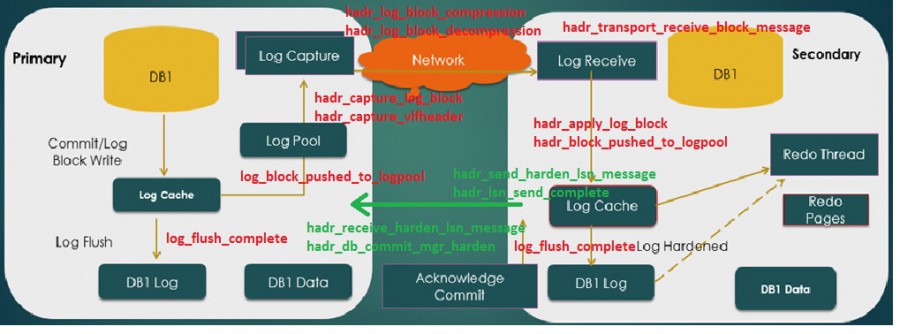
For an easier understanding, I tried to draw a picture of the AlwaysOn replication process by placing the extended events at their correct location in the replication stack. Please feel free to comment if you find out any mistakes.
As said earlier, these new extended events will probably make some troubleshooting stuffs easier and in this blog post I would like to focus on two latency issues I faced at customer places where I noticed high HADR_SYNC_COMMIT wait type values but the root cause was not the same.
I decided to simulate these two issues on my lab environment (one simple architecture that includes one availability group, two replicas involved in synchronous replication and run with SQL Server 2014 SP2). My main goal was to check if the new extended events were able to locate quickly where the root cause is located in each case.
So the first thing to do is to implement and to enable a customized AlwaysOn extended event session that includes all the events displayed in the above picture on each side (both primary and secondary). I used directly the definition of the extended event shared by Amit Banerjee on GitHub.
CREATE EVENT SESSION [AlwaysOn_Data_Movement_Tracing]
ON SERVER
ADD EVENT sqlserver.hadr_apply_log_block,
ADD EVENT sqlserver.hadr_capture_filestream_wait,
ADD EVENT sqlserver.hadr_capture_log_block,
ADD EVENT sqlserver.hadr_capture_vlfheader,
ADD EVENT sqlserver.hadr_database_flow_control_action,
ADD EVENT sqlserver.hadr_db_commit_mgr_harden,
ADD EVENT sqlserver.hadr_log_block_compression,
ADD EVENT sqlserver.hadr_log_block_decompression,
ADD EVENT sqlserver.hadr_log_block_group_commit,
ADD EVENT sqlserver.hadr_log_block_send_complete,
ADD EVENT sqlserver.hadr_lsn_send_complete,
ADD EVENT sqlserver.hadr_receive_harden_lsn_message,
ADD EVENT sqlserver.hadr_send_harden_lsn_message,
ADD EVENT sqlserver.hadr_transport_flow_control_action,
ADD EVENT sqlserver.hadr_transport_receive_log_block_message,
ADD EVENT sqlserver.log_block_pushed_to_logpool,
ADD EVENT sqlserver.log_flush_complete,
ADD EVENT sqlserver.log_flush_start,
ADD EVENT sqlserver.recovery_unit_harden_log_timestamps,
ADD EVENT ucs.ucs_connection_send_msg
(
    WHERE ([correlation_id]<>(0))
)
ADD TARGET package0.event_file
(
	SET filename=N'AlwaysOn_Data_Movement_Tracing.xel',max_rollover_files=(100)
)
WITH
(
	MAX_MEMORY=4096 KB,
	EVENT_RETENTION_MODE=ALLOW_SINGLE_EVENT_LOSS,
	MAX_DISPATCH_LATENCY=30 SECONDS,
	MAX_EVENT_SIZE=0 KB,
	MEMORY_PARTITION_MODE=NONE,
	TRACK_CAUSALITY=OFF,
	STARTUP_STATE=ON
)
GO
Firstly, I have to warn about the use of such trace because it may generate a large amount of data depending mainly on the workload activity. In my test scenario, the extended event session has generated up to 4GB of events in a time interval of 20 minutes. So we will have probably to think about some customizations that might be needed according the context in order to minimize the overall performance impact and the disk usage as well.
Then, after collecting extended events data, I experienced a very long execution time and a high tempdb usage as well by using the initial extraction script provided by Amit Banerjee on GitHub. In my case, the script took approximatively 9 hours to finish on my lab environment with 4 VCPUs and 4GB of RAM. This is definitely not a good way to perform quickly further analysis on collected data. My first feeling was the script was designed for the demonstration purpose with few data. So in order to handle larger collected data, I decided to modify the initial version of the script to reduce the extract duration time. It took less than 2h for the same amount of data in my case). You will also notice that I reduced the number of extracted data to the minimum in order to meet my own requirements (I only have two replicas in my case). But let’s say that I’m still in a process of improving the performance of the extraction script in order to meet more realistic production scenarios. So here my own version of the script used in this blog post:
SET NOCOUNT ON

IF OBJECT_ID('tempdb..#xe_AlwaysOn_Data_Movement_Tracing', 'U') IS NOT NULL
	DROP TABLE #xe_AlwaysOn_Data_Movement_Tracing;


SELECT
	object_name as event_name,
	CONVERT(XML,Event_data) AS event_data
INTO #xe_AlwaysOn_Data_Movement_Tracing
FROM sys.fn_xe_file_target_read_file(
			'C:\Program Files\Microsoft SQL Server\MSSQL12.SQL14\MSSQL\Log\AlwaysOn_Data_Movement_Tracing_0_*.xel',
			null, null, null) as xe
where object_name in ('hadr_log_block_group_commit',
						'log_block_pushed_to_logpool',
						'log_flush_start',
						'log_flush_complete',
						'hadr_log_block_compression',
						'hadr_capture_log_block',
						'hadr_capture_filestream_wait',
						'hadr_log_block_send_complete',
						'hadr_receive_harden_lsn_message',
						'hadr_db_commit_mgr_harden',
						'recovery_unit_harden_log_timestamps',
						'hadr_capture_vlfheader',
						'hadr_log_block_decompression',
						'hadr_apply_log_block',
						'hadr_send_harden_lsn_message',
						'hadr_log_block_decompression',
						'hadr_lsn_send_complete',
						'hadr_transport_receive_log_block_message');


IF OBJECT_ID('dbo.DMReplicaEvents', 'U') IS NOT NULL
	DROP TABLE dbo.DMReplicaEvents_primary;

CREATE TABLE [dbo].[DMReplicaEvents_primary](
	[server_name] [nvarchar](128) NULL,
	[event_name] [nvarchar](60) NOT NULL,
	[log_block_id] [bigint] NULL,
	[database_id] [int] NULL,
	[processing_time] [bigint] NULL,
	[start_timestamp] [bigint] NULL,
	[publish_timestamp] [datetimeoffset](7) NULL,
	[log_block_size] [int] NULL,
	[target_availability_replica_id] [uniqueidentifier] NULL,
	[mode] [bigint] NULL
) ON [PRIMARY]


INSERT INTO DMReplicaEvents_Primary
SELECT
	@@SERVERNAME as server_name,
	event_name,
	xe.event_data.value('(/event/data[@name="log_block_id"]/value)[1]','bigint') AS log_block_id,
	xe.event_data.value('(/event/data[@name="database_id"]/value)[1]','int') AS database_id,
	CASE event_name
		WHEN 'hadr_db_commit_mgr_harden' THEN xe.event_data.value('(/event/data[@name="time_to_commit"]/value)[1]','bigint')
		WHEN 'hadr_apply_log_block' THEN xe.event_data.value('(/event/data[@name="total_processing_time"]/value)[1]','bigint')
		WHEN 'hadr_log_block_send_complete' THEN xe.event_data.value('(/event/data[@name="total_processing_time"]/value)[1]','bigint')
		WHEN 'hadr_lsn_send_complete' THEN xe.event_data.value('(/event/data[@name="total_processing_time"]/value)[1]','bigint')
		WHEN 'log_flush_complete' THEN xe.event_data.value('(/event/data[@name="duration"]/value)[1]','bigint') * 1000
		ELSE xe.event_data.value('(/event/data[@name="processing_time"]/value)[1]','bigint')
	END AS processing_time,
	xe.event_data.value('(/event/data[@name="start_timestamp"]/value)[1]','bigint') AS start_timestamp,
	xe.event_data.value('(/event/@timestamp)[1]','DATETIMEOFFSET') AS publish_timestamp,
	CASE event_name
		WHEN 'hadr_log_block_compression' THEN xe.event_data.value('(/event/data[@name="uncompressed_size"]/value)[1]','int')
		WHEN 'hadr_log_block_decompression' THEN xe.event_data.value('(/event/data[@name="uncompressed_size"]/value)[1]','int')
		WHEN 'hadr_capture_log_block' THEN xe.event_data.value('(/event/data[@name="log_block_size"]/value)[1]','int')
		ELSE NULL
	END AS log_block_size,
	CASE event_name
		WHEN 'hadr_db_commit_mgr_harden' THEN xe.event_data.value('(/event/data[@name="replica_id"]/value)[1]','uniqueidentifier')
		WHEN 'hadr_log_block_compression' THEN xe.event_data.value('(/event/data[@name="availability_replica_id"]/value)[1]','uniqueidentifier')
		WHEN 'hadr_log_block_decompression' THEN xe.event_data.value('(/event/data[@name="availability_replica_id"]/value)[1]','uniqueidentifier')
		WHEN 'hadr_capture_log_block' THEN xe.event_data.value('(/event/data[@name="availability_replica_id"]/value)[1]','uniqueidentifier')
		WHEN 'hadr_capture_filestream_wait' THEN xe.event_data.value('(/event/data[@name="availability_replica_id"]/value)[1]','uniqueidentifier')
		WHEN 'hadr_receive_harden_lsn_message' THEN xe.event_data.value('(/event/data[@name="target_availability_replica_id"]/value)[1]','uniqueidentifier')
		WHEN 'hadr_transport_receive_log_block_message' THEN xe.event_data.value('(/event/data[@name="target_availability_replica_id"]/value)[1]','uniqueidentifier')
		WHEN 'hadr_capture_vlfheader' THEN xe.event_data.value('(/event/data[@name="availability_replica_id"]/value)[1]','uniqueidentifier')
		WHEN 'hadr_send_harden_lsn_message' THEN xe.event_data.value('(/event/data[@name="availability_replica_id"]/value)[1]','uniqueidentifier')
		ELSE NULL
	END AS target_availability_replica_id,
	xe.event_data.value('(/event/data[@name="mode"]/value)[1]','bigint') AS mode
--INTO DMReplicaEvents
FROM #xe_AlwaysOn_Data_Movement_Tracing xe
Having talked about the data collector aspect, let’s continue by using it against my two latency issue scenarios:
First scenario (network bandwidth issue)
My first test consisted in simulating a network bandwidth issue by limiting the maximum bandwidth of the public network card as low as possible to trigger a noticeable increase of the availability group replication latency. This is what you may see in the following picture between 19:37 and 19:42. The average transaction delay (or latency) increases accordingly up to 17ms against 2ms during normal processing.
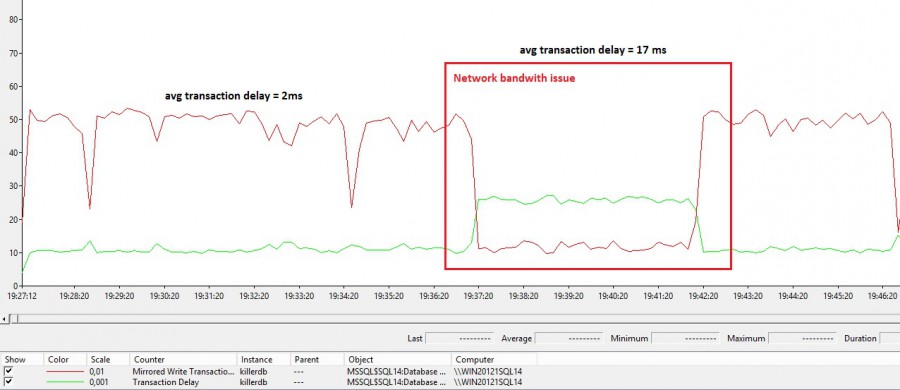
If we take a look at the wait statistics we may found out the HADR_SYNC_COMMIT wait stat with an average value of 20ms.

But at this point we only know that we are experiencing latency issues but we didn’t get any additional information to prove that the network is the culprit. This is where new extended events come into play. I used Excel to consume collected data and to produce charts for a better analysis. Here the picture of the first test scenario (total processing time per event) :
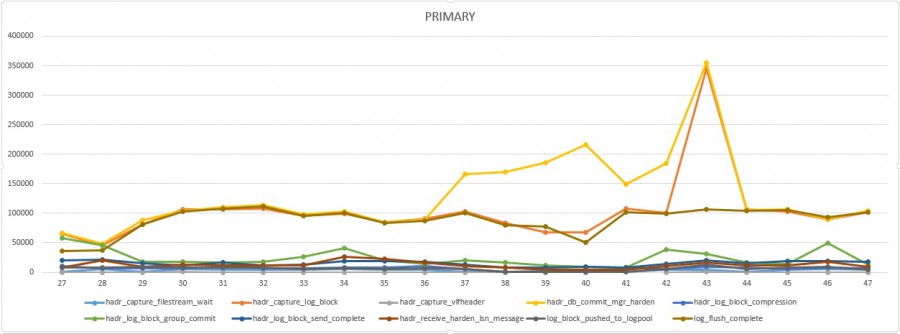
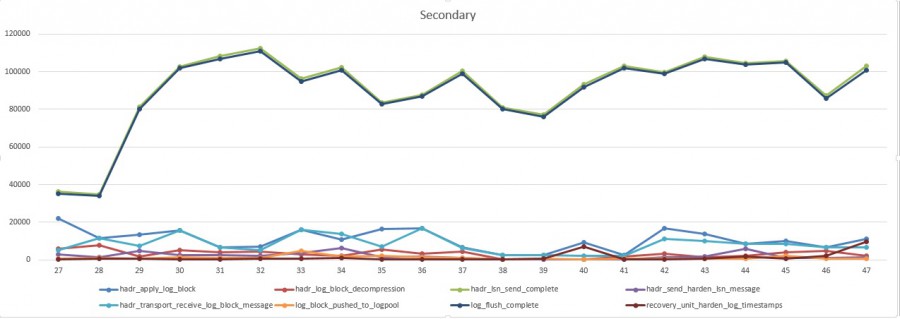
From the above charts, we may easily notice between 19:37 and 19:43 an increase of the hadr_db_commit_mgr_harden processing time on the primary. Other events stay constant over the time. Referring to the first replication diagram, we know this event type represents the remote response from the secondary that increases during the concerned time interval. Furthermore, from the secondary, we may see constant processing time values for all events meaning that the root cause doesn’t seem to concern the secondary itself but certainly an external item between the primary and the secondary, so in this case probably the network stack. By using new extended events, we were able to point out quickly the issue and perform further investigations on the network side.
Second scenario (storage performance issue)
Let’s continue with the second scenario. At first glance we may see the same kind of wait type after the second test meaning that we’re facing the same latency issue as the previous scenario

But this time the root cause is not the same as we may see very soon by looking at the following extended event charts
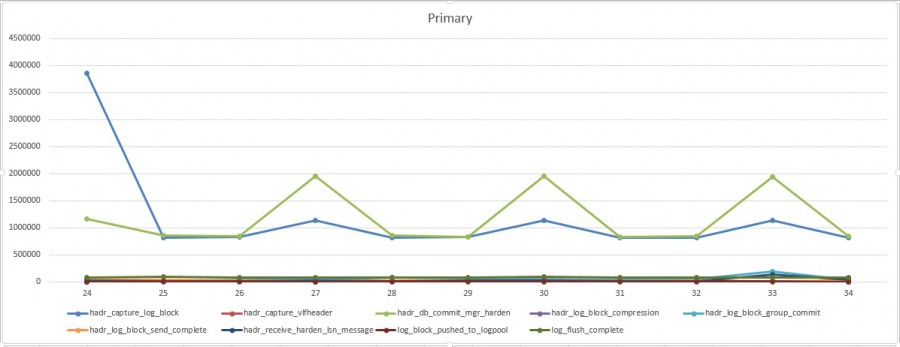
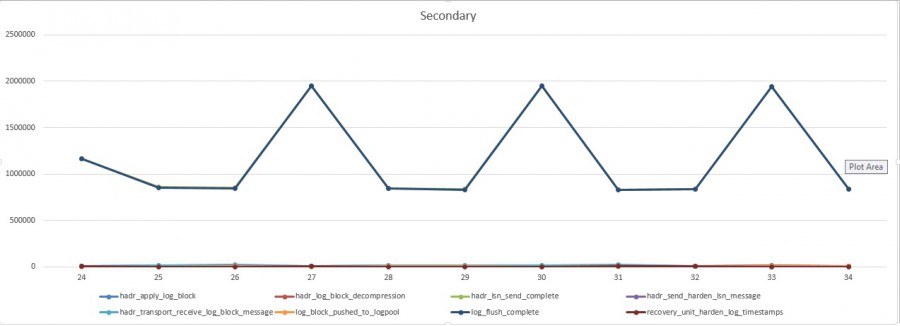
This time, we may notice a pretty obvious correlation between the two charts (primary and secondary replicas). Indeed, each time the remote response time (in other words the latency) increases from the primary, we may see the same increase of the log_flush_complete processing time from the secondary and with the same order of magnitude. In this case, we may quickly focus on database file (and storage) response time on the secondary replica. In my case I voluntary used a very slow storage to host the killerdb transaction log file as you may see below at the database file io statistics

Bottom line
In this blog post, we have seen how useful may be the new extended events shipped with new service packs of SQL Server and we probably have just scratched the surface. But I think we have to keep in mind that using these new extended events has a cost and for the moment I must admit to be not confident to use blindly the initial version script of collecting on production for the reasons cited above. I have to investigate further on a better way to collect and extract data in a real situation.
Happy troubleshooting!
By David Barbarin
![Thumbnail [60x60]](https://www.dbi-services.com/blog/wp-content/uploads/2022/12/microsoft-square.png)
![Thumbnail [90x90]](https://www.dbi-services.com/blog/wp-content/uploads/2022/08/DWE_web-min-scaled.jpg)