On Windows world, SQL Server logs information both into the SQL Server error log and the Application log. Both automatically timestamp all recorded events. Unlike the SQL Server error log, the Windows application log provides an overall picture of events that occur globally on the Windows operating system. Thus, regarding the encountered issues taking a look at such event logs – by using either the Windows event viewer or the Get-EventLog PowerShell cmdlet – may be very helpful to figure out they are only SQL Server-scoped or if you have to correlate with to other operating system issues.
But what about SQL Server on Linux? Obviously, we may use the same logging technologies. As Windows, SQL Server logs information both in the SQL Server error log located on /var/opt/mssql/log/ and in Linux logs. Because SQL Server is only supported on Linux distributions that all include systemd ( RHEL 7.3+, SLES V12 SP2+ or Ubuntu 16.04+) we have to go through the journalctl command to browse the messages related to the SQL Server instance.
systemd-journald is a system service that collects and stores logging data based on logging information that is received from a variety of sources – Kernel and user log messages. All can be viewed through the journalctl command.
Let’s say that the journalctl command is very powerful and I don’t aim to cover all the possibilities. My intention is only to dig into some examples in the context of SQL Server. Conceptually this is not so different than we may usually do on Windows system for basic stuff.
Firstly, let’s say we may use a couple of options to filter records we want to display. Probably the first intuitive way to go through the journalctl command is to use time interval parameters as –since and –until as follows:
[root@sqllinux ~] journalctl --since "2018-01-16 12:00:00" --until "2018-01-16 23:30:00"
Here a sample of the corresponding output:
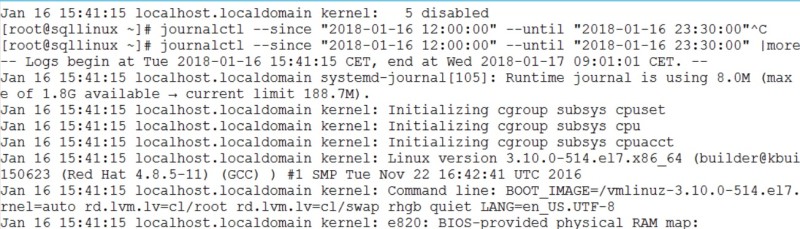
All log messages are displayed including the kernel. But rather than using time interval filters we may prefer to use the -b parameter to show all log messages since the last system boot for instance:
[root@sqllinux ~] journalctl -b
The corresponding output:
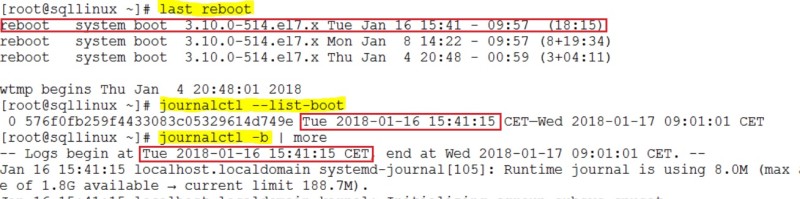
You may use different commands to get the system reboot as uptime, who -b. I’m in favour of last reboot because it provides the last reboot date rather than the uptime of the system.
Furthermore, one interesting point is that if you want to get log messages from older system boots (and not only the last one) you have to setup accordingly system-journald to enable log persistence. By default, it is volatile and logs are cleared after each system reboot. You may get this information directly from the system-journald configuration file (#Storage=auto by default):
[root@sqllinux ~] cat /etc/systemd/journald.conf
…
[Journal]
#Storage=auto
#Compress=yes
#Seal=yes
…
I remembered a customer case where I had to diagnose a database check integrity job scheduled on each Sunday and that failed randomly. We finally figure out that the root cause was a system reboot after an automatic update. But the tricky part was that not all system reboots did not lead to fail the DBCC CHECKDB command and according to the information from the Windows log we understood it depended mostly on the DBCC CHECKDB command execution time which sometimes exceeded the time scheduled for system reboot. So, in this case going back to the previous reboots (before the last one) was helpful for us. Let’s say that for some Linux distributions this is not the default option and my colleague Daniel Westermann in the dbi services open source team explained it well through his blog post and how to change the default behavior as well.
So, after applying the correct setup, if you want to display log messages after a pre-defined boot time you may first identify the different system boot times logged into the journal as follows:
[root@sqllinux ~] journalctl --list-boots
-1 576f0fb259f4433083c05329614d749e Tue 2018-01-16 15:41:15 CET—Wed 2018-01-17 20:30:41 CET
 0 ea3ec7019f8446959cfad0bba517a47e Wed 2018-01-17 20:33:30 CET—Wed 2018-01-17 20:37:05 CET
Then you may rewind the journal until the corresponding offset:
[root@sqllinux ~] journalctl -b -1
-- Logs begin at Tue 2018-01-16 15:41:15 CET, end at Wed 2018-01-17 20:37:40 CET. --
Jan 16 15:41:15 localhost.localdomain systemd-journal[105]: Runtime journal is using 8.0M (max allowed 188.7M, trying to leave 283.1M free
 of 1.8G available → current limit 188.7M).
….
Let’s go ahead with filtering by unit (mssql-server unit). This is likely the most useful way for DBAs to display only SQL Server related records with a combination of the aforementioned options (time interval or last boot(s) parameters). In the following example, I want to display SQL Server related records since a system boot that occurred on 18 January 2018 20:39 (I may also deal with interval time filters)
[root@sqllinux ~] journalctl -b -1 -u mssql-server.service
-- Logs begin at Tue 2018-01-16 15:41:15 CET, end at Wed 2018-01-17 20:39:55 CET. --
Jan 16 15:41:17 sqllinux.dbi-services.test systemd[1]: [/usr/lib/systemd/system/mssql-server.service:21] Unknown lvalue 'TasksMax' in sect
ion 'Service'
Jan 16 20:47:15 sqllinux.dbi-services.test systemd[1]: Started Microsoft SQL Server Database Engine.
Jan 16 20:47:15 sqllinux.dbi-services.test systemd[1]: Starting Microsoft SQL Server Database Engine
...
Jan 16 20:47:22 sqllinux.dbi-services.test sqlservr[1119]: 2018-01-16 20:47:22.35 Server      Microsoft SQL Server 2017 (RTM-CU2) (KB40525
74) - 14.0.3008.27 (X64)
…
You may also want to get only error concerned your SQL Server instance. If you already used syslog in the past you will still be comfortable with systemd-journal that implements the standard syslog message levels and message priorities. Indeed, each message has its own priority as shown below. The counterpart on Windows event log are event types (warning, error, critical etc …). On Linux priorities are identified by number – 6 corresponds to info messages and 3 to error messages. Here an log message’s anatomy with the priority value.
[root@sqllinux ~] journalctl -b -1 -u mssql-server.service -n 1 -o verbose
-- Logs begin at Tue 2018-01-16 15:41:15 CET, end at Wed 2018-01-17 20:48:36 CET. --
Wed 2018-01-17 20:30:38.937388 CET [s=5903eef6a5fd45e584ce03a4ae329ac3;i=88d;b=576f0fb259f4433083c05329614d749e;m=13e34d5fcf;t=562fde1d9a1
    PRIORITY=6
    _UID=0
    _GID=0
    _BOOT_ID=576f0fb259f4433083c05329614d749e
    _MACHINE_ID=70f4e4633f754037916dfb35844b4b16
    SYSLOG_FACILITY=3
    SYSLOG_IDENTIFIER=systemd
    CODE_FILE=src/core/job.c
    CODE_FUNCTION=job_log_status_message
    RESULT=done
    _TRANSPORT=journal
    _PID=1
    _COMM=systemd
    _EXE=/usr/lib/systemd/systemd
    _CAP_EFFECTIVE=1fffffffff
    _SYSTEMD_CGROUP=/
    CODE_LINE=784
    MESSAGE_ID=9d1aaa27d60140bd96365438aad20286
    _HOSTNAME=sqllinux.dbi-services.test
    _CMDLINE=/usr/lib/systemd/systemd --switched-root --system --deserialize 21
    _SELINUX_CONTEXT=system_u:system_r:init_t:s0
    UNIT=mssql-server.service
    MESSAGE=Stopped Microsoft SQL Server Database Engine.
    _SOURCE_REALTIME_TIMESTAMP=1516217438937388
So, if you want to restrict more the output with only warning, error or critical messages (from a daemon point of view), you may have to add the -p option with a range of priorities from 2 (critical) and 4 (warning) as shown below:
[root@sqllinux ~] journalctl -p 2..4 -u mssql-server.service
-- Logs begin at Tue 2018-01-16 15:41:15 CET, end at Wed 2018-01-17 21:44:04 CET. --
Jan 16 15:41:17 sqllinux.dbi-services.test systemd[1]: [/usr/lib/systemd/system/mssql-server.service:21] Unknown lvalue 'TasksMax' in sect
-- Reboot --
Jan 17 15:27:42 sqllinux.dbi-services.test systemd[1]: [/usr/lib/systemd/system/mssql-server.service:21] Unknown lvalue 'TasksMax' in sect
lines 1-4/4 (END)
Ultimately, filtering by message will be probably the most natural way to find out log messages. Let’s say in this case there is no built-in parameters or options provided by journalctl command and grep will be your friend for sure. In the following example, a classic customer case where we want to count number of failed logins during a specific period. So, I will have to use a combination of journalctl, grep and wc commands:
[root@sqllinux ~] journalctl -u mssql-server.service --since "2018-01-17 12:00:00" --until "2018-01-17 23:00:00"  | grep "Login failed" | wc -l
31
Finally, the journalctl command offers real-time capabilities to follow log messages through the -f option. For very specific cases it might be useful. In the example below I can use it to follow SQL Server related log messages:
[root@sqllinux ~] journalctl -u mssql-server.service -f
-- Logs begin at Tue 2018-01-16 15:41:15 CET. --
Jan 17 21:52:57 sqllinux.dbi-services.test sqlservr[1121]: 2018-01-17 21:52:57.97 Logon       Error: 18456, Severity: 14, State: 8.
Jan 17 21:52:57 sqllinux.dbi-services.test sqlservr[1121]: 2018-01-17 21:52:57.97 Logon       Login failed for user 'sa'. Reason: Password did not match that for the login provided. [CLIENT: 192.168.40.30]
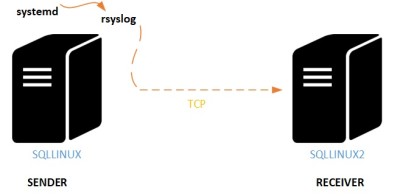
Another topic I wanted to introduce is the centralized logging management. Nowadays, a plenty of third party tools like splunk – or built-in Microsoft tools as SCOM – may address this need both on Windows and Linux world. I also remembered a special customer case where we went through built-in Windows event forwarding mechanism. On Linux world, you may benefit from a plenty of open source tools and you may also rely on built-in Linux tools as systemd-journal-remote, systemd-journal-upload and systemd-journal-gateway as well. I will probably go further into these tools in the future but this time let’s use an older tool rsyslog that implements the basic syslog protocol and extends it with additional features. In this blog post I used a CentOS 7 distro that comes with rsyslog. The good news is that it also includes by default the imjournal module (that provides access to the systemd journal). This module reads log from /run/log/journal and then writes out /var/log/messages, /var/log/maillog, /var/log/secure or others regarding the record type. Log records may be send over TCP or UDP protocols and securing capabilities are also provided (by using TLS and certificates for instance).
Just out of curiosity, I decided to implement a very simple log message forwarding scenario to centralize only SQL Server log messages. Basically, I only had to setup some parameters in the /etc/rsyslog.conf on both sides (sender and receiver servers) as well as applying some firewall rules to allow the traffic on port 514. In addition, I used TCP protocol because this is probably the simplest way to send log messages (because corresponding module are already loaded). Here an illustration of my scenario:
Here the configuration settings of my log message sender. You may notice that I used expression-Based filters to filter and to send only my SQL Server instance related messages :
[root@sqllinux ~] cat /etc/rsyslog.conf
#### MODULES ####

# The imjournal module bellow is now used as a message source instead of imuxsock.
$ModLoad imuxsock # provides support for local system logging (e.g. via logger command)
$ModLoad imjournal # provides access to the systemd journal
#$ModLoad imklog # reads kernel messages (the same are read from journald)
#$ModLoad immark  # provides --MARK-- message capability
…
# remote host is: name/ip:port, e.g. 192.168.0.1:514, port optional
#*.* @@remote-host:514
if $programname == 'sqlservr' then @@192.168.40.21:514
…
On the receiver side I configured rsyslog daemon to accept messages that come from TCP protocol and port 514. Here a sample (only the interesting part) of the configuration file:
[root@sqllinux2 ~] cat /etc/rsyslog.conf
…
# Provides TCP syslog reception
$ModLoad imtcp
$InputTCPServerRun 514
Finally, I ran a simple test to check if the log message forwarding process works correctly by using the following T-SQL command from my SQLLINUX instance …
RAISERROR('test syslog from SQLLINUX instance', 10, 1) WITH LOG
… and after jumping to the receiver side (SQLLINUX2) I used the tail command to check if my message was sent correctly:
[root@sqllinux2 ~] tail -f /var/log/messages
…
Jan 18 21:50:40 sqllinux sqlservr: 2018-01-18 21:50:40.66 spid57      test syslog
Jan 18 21:51:03 sqllinux sqlservr: 2018-01-18 21:51:03.75 spid57      test syslog 1 2 3
Jan 18 21:52:08 sqllinux sqlservr: 2018-01-18 21:52:08.74 spid52      Using 'dbghelp.dll' version '4.0.5'
Jan 18 21:56:31 sqllinux sqlservr: 2018-01-18 21:56:31.13 spid57      test syslog from SQLLINUX instance
Well done!
In this blog post we’ve surfaced how SQL Server deals with Linux logging system and how we may use the journalctl command to find out information for troubleshooting. Moving from Windows to Linux in this field remains straightforward with finally the same basics. Obviously, Linux is a command-line oriented operating system so you will not escape to use them 🙂
By David Barbarin
![Thumbnail [60x60]](https://www.dbi-services.com/blog/wp-content/uploads/2022/12/microsoft-square.png)
![Thumbnail [90x90]](https://www.dbi-services.com/blog/wp-content/uploads/2022/08/DWE_web-min-scaled.jpg)