By Franck Pachot
.
From 12.1.0.2 the Standard Edition – now called Standard Edition 2 – has a few limitations that were not there in SE and SE1. One of them is the limitation to 16 threads. Let’s see how it behaves when running 32 sessions working in CPU.
Installing 12.1 SE2 on a 32 CPU host.
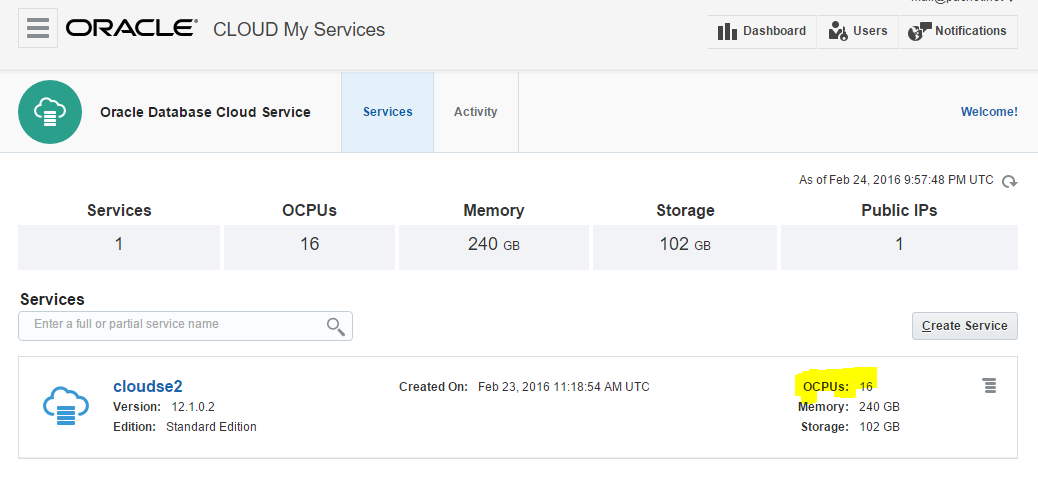
What to provision quickly a host with more than 16 CPU? Easy with DBaaS. Here is a database on the Oracle Cloud Services, with 16 OCPU which means 32 threads:
Here is the definition from the OS seeing 32 cores (which are actually virtual, equivalent to 16 hyper-threaded cores)
Architecture:          x86_64
CPU op-mode(s):        32-bit, 64-bit
Byte Order:            Little Endian
CPU(s):                32
On-line CPU(s) list:   0-31
Thread(s) per core:    1
Core(s) per socket:    32
Socket(s):             1
NUMA node(s):          1
Vendor ID:             GenuineIntel
CPU family:            6
Model:                 62
Stepping:              4
CPU MHz:               2992.876
BogoMIPS:              5985.75
Hypervisor vendor:     Xen
Virtualization type:   full
L1d cache:             32K
L1i cache:             32K
L2 cache:              256K
L3 cache:              25600K
NUMA node0 CPU(s):     0-31
dedicated, shared, pooled, jobs
I’m running something like that:
set echo on timing on
connect scott/tiger @ //140.86.5.120/pdb.trial.oraclecloud.internal:dedicated
exec declare t date:=sysdate; begin loop exit when sysdate>t+&1./24/60/60; end loop; end
exit
and the same with shared and pooled connections.
Finally, I run the same from a job:
variable j number
exec dbms_job.submit(:j,'declare t date:=sysdate; begin loop exit when sysdate>t+&1./24/60/60; end loop; end;');
I’ve run those from 32 parallel sessions and got the following:
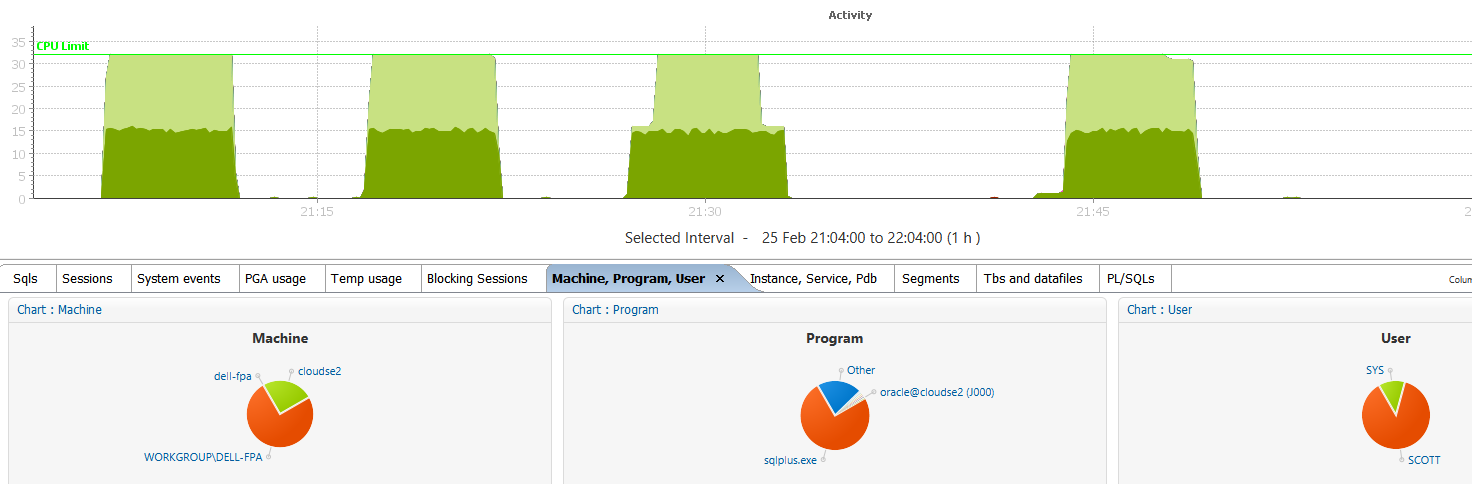
You can see my 32 sessions active, but only 16 at a time being in CPU. The others are waiting on the light green ‘resmgr: cpu quantum’ which is the Resource Manager used to limit to 16 threads in CPU. No way to bypass: whatever the connection type is we are limited to 16 sessions active on CPU.
From ‘top’ we can check that each session has the same amout of CPU time allowed:
SQL> Disconnected from Oracle Database 12c Standard Edition Release 12.1.0.2.0 - 64bit Production^M
top - 20:59:09 up 2 days,  9:34,  1 user,  load average: 9.88, 4.23, 1.68
Tasks: 644 total,  13 running, 631 sleeping,   0 stopped,   0 zombie
Cpu(s):  1.1%us,  0.4%sy,  0.0%ni, 98.4%id,  0.1%wa,  0.0%hi,  0.0%si,  0.1%st
Mem:  247354096k total, 135891524k used, 111462572k free,   785304k buffers
Swap:  4194300k total,        0k used,  4194300k free, 131373540k cached

   PID USER      PR  NI  VIRT  RES  SHR S %CPU %MEM    TIME+  COMMAND
  5586 root      20   0 2785m  41m 9212 S 72.3  0.0   0:00.37 /u01/app/oracle/pr
  3796 oracle    20   0 56.6g  28m  26m S 43.0  0.0   1:11.87 oracleSE2 (LOCAL=N
  3768 oracle    20   0 56.6g  44m  40m S 41.0  0.0   1:13.15 oracleSE2 (LOCAL=N
  3774 oracle    20   0 56.6g  28m  25m S 41.0  0.0   1:12.64 oracleSE2 (LOCAL=N
  3792 oracle    20   0 56.6g  28m  25m S 41.0  0.0   1:12.08 oracleSE2 (LOCAL=N
  3800 oracle    20   0 56.6g  28m  26m S 41.0  0.0   1:11.67 oracleSE2 (LOCAL=N
  3802 oracle    20   0 56.6g  28m  26m S 41.0  0.0   1:11.78 oracleSE2 (LOCAL=N
  3804 oracle    20   0 56.6g  28m  26m S 41.0  0.0   1:11.55 oracleSE2 (LOCAL=N
  3824 oracle    20   0 56.6g  28m  26m S 41.0  0.0   1:11.21 oracleSE2 (LOCAL=N
  3826 oracle    20   0 56.6g  28m  26m S 41.0  0.0   1:11.15 oracleSE2 (LOCAL=N
  3832 oracle    20   0 56.6g  28m  26m S 41.0  0.0   1:11.10 oracleSE2 (LOCAL=N
  3776 oracle    20   0 56.6g  28m  25m S 39.1  0.0   1:12.55 oracleSE2 (LOCAL=N
...
That was with dedicated sessions (SERVER=dedicated)
Here are the processes with shared servers (SERVER=shared):
   PID USER      PR  NI  VIRT  RES  SHR S %CPU %MEM    TIME+  COMMAND
 35128 oracle    20   0 56.6g  24m  22m R 58.1  0.0   1:01.94 ora_j011_SE2
 35140 oracle    20   0 56.6g  24m  21m R 58.1  0.0   1:01.18 ora_j017_SE2
 35154 oracle    20   0 56.6g  24m  21m R 58.1  0.0   1:00.29 ora_j024_SE2
  2849 oracle    20   0 56.6g 283m 279m R 56.2  0.1   1:08.65 ora_j000_SE2
 35116 oracle    20   0 56.6g  24m  21m S 56.2  0.0   1:02.26 ora_j005_SE2
 35124 oracle    20   0 56.6g  24m  21m S 56.2  0.0   1:02.06 ora_j009_SE2
 35130 oracle    20   0 56.6g  24m  21m S 56.2  0.0   1:01.87 ora_j012_SE2
 34367 oracle    20   0 56.6g  35m  32m S 54.3  0.0   1:06.10 ora_j002_SE2
...
or with resident connection pooling (SERVER=pooled):
   PID USER      PR  NI  VIRT  RES  SHR S %CPU %MEM    TIME+  COMMAND
 17227 oracle    20   0 56.6g  26m  23m R 59.7  0.0   1:08.01 ora_l035_SE2
 17170 oracle    20   0 56.6g  26m  23m R 57.8  0.0   1:15.21 ora_l013_SE2
 17176 oracle    20   0 56.6g  26m  23m R 57.8  0.0   1:14.87 ora_l016_SE2
 17205 oracle    20   0 56.6g  26m  23m S 57.8  0.0   1:08.02 ora_l024_SE2
 17207 oracle    20   0 56.6g  26m  23m R 57.8  0.0   1:07.90 ora_l025_SE2
 17162 oracle    20   0 56.6g  26m  23m R 55.9  0.0   1:15.47 ora_l009_SE2
 17174 oracle    20   0 56.6g  26m  23m S 55.9  0.0   1:14.80 ora_l015_SE2
 17225 oracle    20   0 56.6g  26m  23m S 55.9  0.0   1:08.30 ora_l034_SE2
 17201 oracle    20   0 56.6g  26m  23m R 54.0  0.0   1:08.11 ora_l022_SE2
 17203 oracle    20   0 56.6g  26m  23m S 54.0  0.0   1:08.15 ora_l023_SE2
 17166 oracle    20   0 56.6g  26m  23m R 52.0  0.0   1:15.33 ora_l011_SE2
 17180 oracle    20   0 56.6g  26m  23m R 52.0  0.0   1:14.60 ora_l018_SE2
 17209 oracle    20   0 56.6g  26m  23m R 52.0  0.0   1:08.08 ora_l026_SE2
 17223 oracle    20   0 56.6g  26m  23m S 52.0  0.0   1:08.18 ora_l033_SE2
 17182 oracle    20   0 56.6g  26m  23m R 50.1  0.0   1:14.48 ora_l019_SE2
...
Same with jobs:
   PID USER      PR  NI  VIRT  RES  SHR S %CPU %MEM    TIME+  COMMAND
 35128 oracle    20   0 56.6g  24m  22m R 58.1  0.0   1:01.94 ora_j011_SE2
 35140 oracle    20   0 56.6g  24m  21m R 58.1  0.0   1:01.18 ora_j017_SE2
 35154 oracle    20   0 56.6g  24m  21m R 58.1  0.0   1:00.29 ora_j024_SE2
  2849 oracle    20   0 56.6g 283m 279m R 56.2  0.1   1:08.65 ora_j000_SE2
 35116 oracle    20   0 56.6g  24m  21m S 56.2  0.0   1:02.26 ora_j005_SE2
 35124 oracle    20   0 56.6g  24m  21m S 56.2  0.0   1:02.06 ora_j009_SE2
 35130 oracle    20   0 56.6g  24m  21m S 56.2  0.0   1:01.87 ora_j012_SE2
 34367 oracle    20   0 56.6g  35m  32m S 54.3  0.0   1:06.10 ora_j002_SE2
...
and I also tried with the new 12c threaded processes (DEDICATED_THROUGH_BROKER_listener=true):
top - 21:13:33 up 1 day,  9:49,  0 users,  load average: 7.54, 4.81, 3.58
Tasks: 590 total,  17 running, 573 sleeping,   0 stopped,   0 zombie
Cpu(s):  1.3%us,  0.3%sy,  0.0%ni, 98.2%id,  0.1%wa,  0.0%hi,  0.0%si,  0.1%st
Mem:  247354096k total, 135538012k used, 111816084k free,   700228k buffers
Swap:  4194300k total,        0k used,  4194300k free, 131260340k cached

   PID USER      PR  NI  VIRT  RES  SHR S %CPU %MEM    TIME+  COMMAND
 58046 oracle    20   0 63.8g 886m 689m S 54.8  0.4   5:24.47 ora_u005_SE2
 58049 oracle    20   0 63.8g 886m 689m R 54.8  0.4   5:23.70 ora_u005_SE2
 58065 oracle    20   0 63.8g 886m 689m R 52.8  0.4   1:38.75 ora_u005_SE2
 58043 oracle    20   0 63.8g 886m 689m S 50.9  0.4   5:24.19 ora_u005_SE2
 58045 oracle    20   0 63.8g 886m 689m S 50.9  0.4   5:24.21 ora_u005_SE2
 58053 oracle    20   0 63.8g 886m 689m R 50.9  0.4   1:36.28 ora_u005_SE2
 58061 oracle    20   0 63.8g 886m 689m R 50.9  0.4   1:36.10 ora_u005_SE2
 58067 oracle    20   0 63.8g 886m 689m R 50.9  0.4   1:12.89 ora_u005_SE2
...
Different processes but same behavior: running 32 session on SE2 gives 50% of CPU resources to each session because of the limitation of 16 threads.
User processes
After lot of tests, some of them with DML to so that LGWR and DBWR has something to do, I’ve checked which sessions have waited on that Resource Manager event:
SQL> select distinct program,username from v$session_event join v$session using(sid) where v$session_event.event like 'resmgr:cpu quantum'

PROGRAM                        USERNAME
------------------------------ ------------------------------
sqlplus.exe                    SYS
sqlplus.exe                    SCOTT
JDBC Thin Client               SYS
This proves that only user sessions are limited by SE2, and you can see it’s the case for SYS as well as other users.
SYS
Talking about SYS, I’ve run 16 sessions as SYS and 16 sessions as SCOTT:
 73056 oracle    20   0 56.6g  25m  23m S 80.3  0.0   0:51.58 oracleSE2 (LOCAL=NO)
 73058 oracle    20   0 56.6g  25m  23m S 80.3  0.0   0:51.36 oracleSE2 (LOCAL=NO)
 73064 oracle    20   0 56.6g  25m  23m S 80.3  0.0   0:51.34 oracleSE2 (LOCAL=NO)
 73052 oracle    20   0 56.6g  25m  23m R 80.0  0.0   0:51.71 oracleSE2 (LOCAL=NO)
 73097 oracle    20   0 56.6g  25m  23m R 80.0  0.0   0:51.21 oracleSE2 (LOCAL=NO)
 73103 oracle    20   0 56.6g  25m  23m R 80.0  0.0   0:51.02 oracleSE2 (LOCAL=NO)
 73111 oracle    20   0 56.6g  25m  23m R 80.0  0.0   0:50.91 oracleSE2 (LOCAL=NO)
 73117 oracle    20   0 56.6g  25m  23m R 79.6  0.0   0:50.89 oracleSE2 (LOCAL=NO)
 73101 oracle    20   0 56.6g  25m  23m R 79.3  0.0   0:50.87 oracleSE2 (LOCAL=NO)
 73050 oracle    20   0 56.6g  25m  23m S 79.0  0.0   0:51.72 oracleSE2 (LOCAL=NO)
 73099 oracle    20   0 56.6g  25m  23m S 78.3  0.0   0:51.10 oracleSE2 (LOCAL=NO)
 73060 oracle    20   0 56.6g  25m  23m S 78.0  0.0   0:51.23 oracleSE2 (LOCAL=NO)
 73108 oracle    20   0 56.6g  25m  23m R 78.0  0.0   0:50.98 oracleSE2 (LOCAL=NO)
 73113 oracle    20   0 56.6g  25m  23m S 78.0  0.0   0:50.90 oracleSE2 (LOCAL=NO)
 73115 oracle    20   0 56.6g  25m  23m R 78.0  0.0   0:50.84 oracleSE2 (LOCAL=NO)
 73106 oracle    20   0 56.6g  25m  23m R 77.3  0.0   0:50.90 oracleSE2 (LOCAL=NO)
 72455 oracle    20   0 56.6g  46m  42m R  7.0  0.0   0:58.55 oracleSE2 (LOCAL=NO)
 72459 oracle    20   0 56.6g  28m  25m S  7.0  0.0   0:58.38 oracleSE2 (LOCAL=NO)
 72461 oracle    20   0 56.6g  28m  25m S  7.0  0.0   0:58.12 oracleSE2 (LOCAL=NO)
 72463 oracle    20   0 56.6g  28m  26m S  7.0  0.0   0:58.17 oracleSE2 (LOCAL=NO)
 72465 oracle    20   0 56.6g  28m  25m S  7.0  0.0   0:58.08 oracleSE2 (LOCAL=NO)
 72467 oracle    20   0 56.6g  28m  26m S  7.0  0.0   0:58.01 oracleSE2 (LOCAL=NO)
 72471 oracle    20   0 56.6g  28m  26m S  7.0  0.0   0:57.89 oracleSE2 (LOCAL=NO)
 72469 oracle    20   0 56.6g  28m  25m S  6.6  0.0   0:57.87 oracleSE2 (LOCAL=NO)
 72473 oracle    20   0 56.6g  28m  26m S  6.6  0.0   0:57.81 oracleSE2 (LOCAL=NO)
 72477 oracle    20   0 56.6g  28m  26m S  6.6  0.0   0:57.73 oracleSE2 (LOCAL=NO)
 72489 oracle    20   0 56.6g  28m  26m S  6.6  0.0   0:57.64 oracleSE2 (LOCAL=NO)
 72493 oracle    20   0 56.6g  28m  26m S  6.6  0.0   0:57.45 oracleSE2 (LOCAL=NO)
 72457 oracle    20   0 56.6g  28m  26m S  6.3  0.0   0:58.59 oracleSE2 (LOCAL=NO)
 72491 oracle    20   0 56.6g  28m  26m R  6.0  0.0   0:57.65 oracleSE2 (LOCAL=NO)
 72481 oracle    20   0 56.6g  28m  25m R  4.6  0.0   0:57.73 oracleSE2 (LOCAL=NO)
 72475 oracle    20   0 56.6g  28m  25m S  3.3  0.0   0:57.67 oracleSE2 (LOCAL=NO)
Here you see that not all sessions are equal. Some are able to run 80% of their time in CPU and the others less than 10%
Let’s see more detail from Orachrome Lighty:
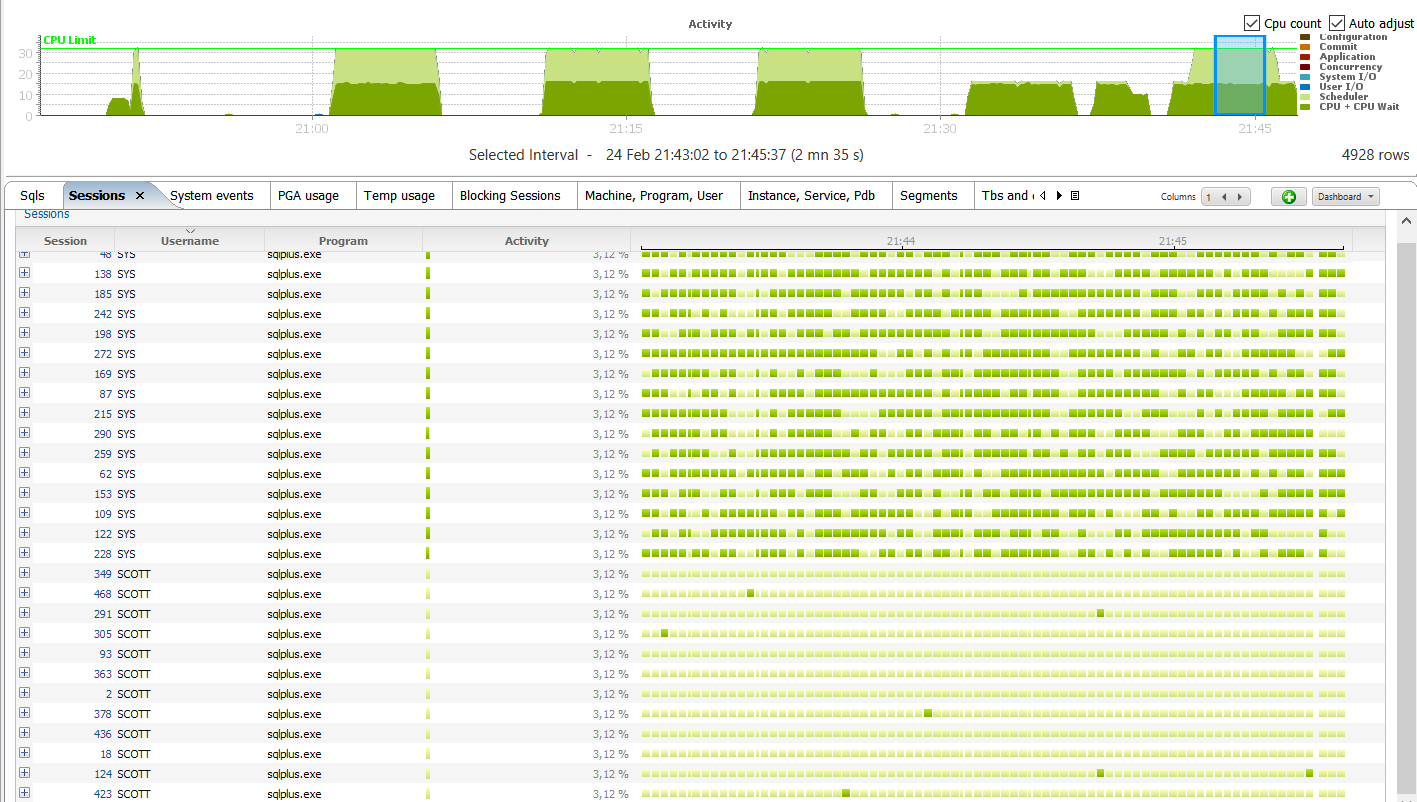
Here it’s clear. the SYS session had higher priority. They were able to run 80% of their time in CPU, and only 20% waiting. The SCOTT session here had only 10% of their time in CPU.
Conclusion
The first observation is that only 16 CPU threads are available for user sessions in a SE2 instance. Yes it is a limitation that was not there in SE but remember that SE comes from a time where only few cores were available on servers. My experience is that most of the Standard Edition database I’ve seen can run with optimal performance with only 4 or 5 active sessions in CPU on average. And I’m talking about 10000 queries per second OLTP applications here. If you reach 16 AAS in CPU then you should look at the queries that read millions of logical reads and you may have some tuning to do on them.
The second observation is that you should be very careful when running jobs as SYS (maintenance, monitoring). They have a high priority but still count within the 16 threads limitation, so the user session become very limited.
![Thumbnail [60x60]](https://www.dbi-services.com/blog/wp-content/uploads/2022/12/oracle-square.png)
![Thumbnail [90x90]](https://www.dbi-services.com/blog/wp-content/uploads/2022/08/DWE_web-min-scaled.jpg)