As you certainly know, the well-known tool SQLIO is officially deprecated since few months. From my part, I had the opportunity (maybe the last) to use SQLIO for a customer project in order to benchmark the storage for SQL Server AlwaysOn and availability groups. Now it’s time to change for a new benchmark tool : DiskSpd.
First of all, DiskSpd is an open source and free based utility, provided by the Windows development team, it has a modern design and can easily be extended.
As its predecessor, it is an I/O subsystem workload generator that runs via a command line and generates read or write, random or sequential by playing with the number of threads, thread intensity, and setting the block sizes. But that’s not all because it also provides some other significant improvements. Before beginning, I would like to precise that this blog post is not a complete overview of the new tool. For that, you can refer to the Microsoft documentation if you want to get more details. I just want here to point out some topics where DiskSpd stands out from SQLIO.
Let’s start with my lab environment:
- Lenovo T530
- 2 quad cores Intel® Core ™ i7-3630QM 2.4GHz
- 16GB of memory
- One SSD disk (Samsung SSD 840 EVO)
- One mechanic disk HGST HTS725050Axxxxx (7200 RPM)
First, using DiskSpd is relatively intuitive and most of the commands are very similar to SQLIO. For example, you want to simulate SQL Server with OLTP-type workloads. In this case we may use the following sample command as a place to get started:
diskspd -b8K -d30 -h -L -o8 -t8 -r -w30 -c3G c:\diskspd\io.dat > resultssql.txt
- -b8K: 8K block size
- -d30: test will be performed during 30 seconds
- -h: test will be performed by disabling hardware and software caching (similar to SQL Server)
- -L: Display latency information during the test
- -o8: Number of outstanding IO
- -t8: Number of threads
- -r: random IO
- -w30: this is a very interesting parameter here. With SqlSpd we’re able to simulate read and write activity in the same test by providing a ratio. In my case, I know that my OLTP workload has a read write ration equivalent to 70/30.
- -c3G: Size of the test file in gigabytes. You can provide other units like KB, MB or GB
- c:\diskspd\io.dat: path of the test file
- > resultssql.txt: All of the test results will be written into the resultssql.txt
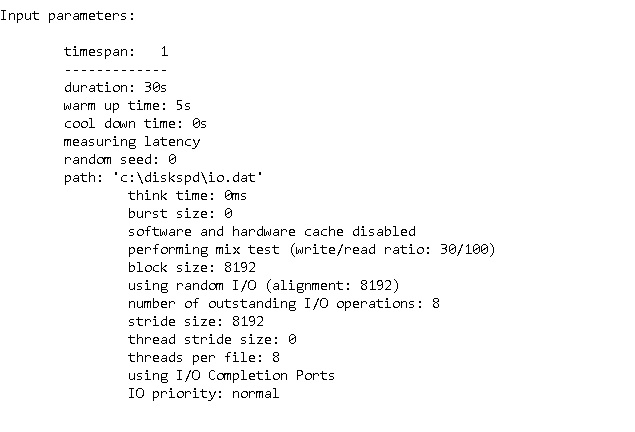
However the output created by DiskSpd is very different from SQLIO and is broken in several sections. Let’s take a look at the result of my first test performing against my SSD drive.
The first section summarizes the different parameters used during the test.
Go ahead and let’s move on the second section.
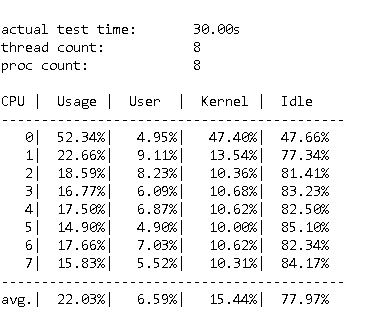
This second section is very useful and displays CPU usage during the test. With SQLIO, we had to implement additional tools like Windows Performance Counters or others to correlate IO and CPU performance data. The above output provides information for CPU usage for each processor as well as a total average value during the test. In my case, no CPU problem is pointed out with the busiest core under 53%.
Let’s continue and let’s take a look at the third section:
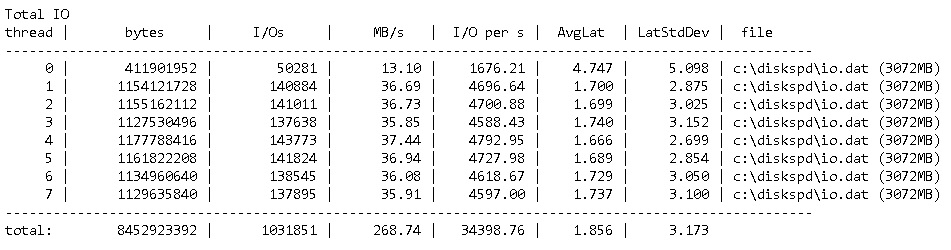
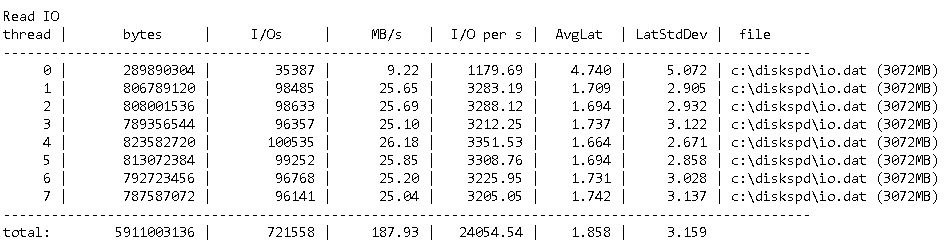
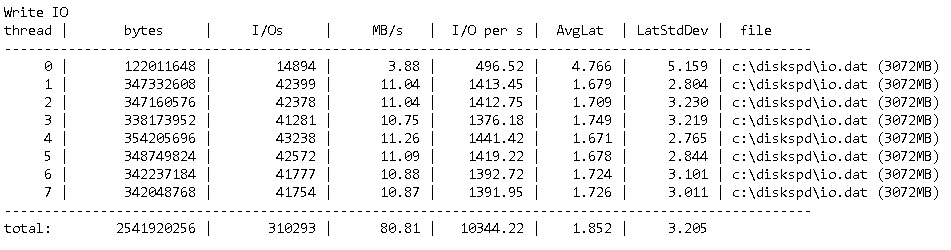
The third section provides a lot of interesting information about IO performance. The first array displays aggregated results (Total IO = Read IO + Write IO) and the two others contain detailed information split by operation type. Each line is related to the worker threads use during the test and the last line displays the total result for all the threads. Have you ever noticed the sub-millisecond based unit of the AvgLat column? Very helpful when you want to test SSD or flash-based storage with latency lower than 1ms.
In addition, having detailed information per worker thread can be helpful in order to detect significant differences if you want to test different storage paths at the same time. For example, you may want to simulate your SQL Server IO activity that includes several database files placed on different disks. In this case you may run this test similar to the test I ran on my lab environment with 2 files on both the disks C: (SSD) and D: (7200 RPM) that don’t have the same characteristics. Another interesting point is the possibility to configure CPU affinity (here CPU 0 -3) in order to limit the number of processors in my test. The command is as follows:
diskspd.exe -c1G -d30 -w0 -r -b8k -t2 -a0,1,2,3 -o16 -h -L C:\testfile.dat D:\testfile.dat> resultssql.txt
Here the interesting part of the result:

As expected in this test, we have a big difference in performance between the two drives, and referring only on the different average values may be misleading in the storage performance analysis.
Then the last section presents a percentile analysis of the storage performance from the minimum value up to the maximum value. This is very helpful to find out quickly the inflection in the data and to get a good overview of the statistical IO distribution for read and write IO latency.
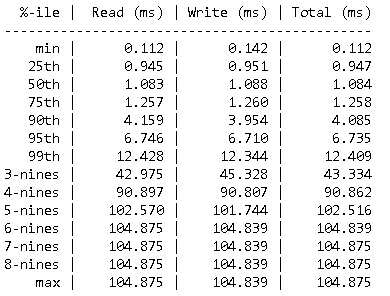
Let focus on write activity in my test: the significant inflection point seems to be located between the 90th and the 95th (1ms -> 6ms). It means less than 5% of the IOs had a latency greater than 6ms and less than 1% are concerned by a latency greater than 10ms.
Let’s compare with the same test performed on my second disk (7200 RPM):
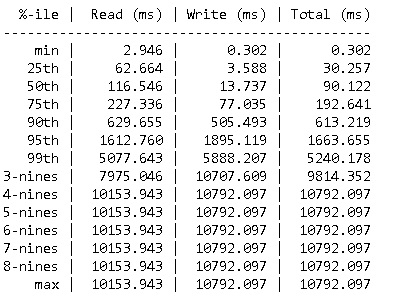
Ok no surprise here and the result is very representative of my 7200 RPM disk performance capabilities . Only 25% of the IO got a latency lower than 4ms … not very good. With SQLIO it was very difficult to gather this data in the same place.
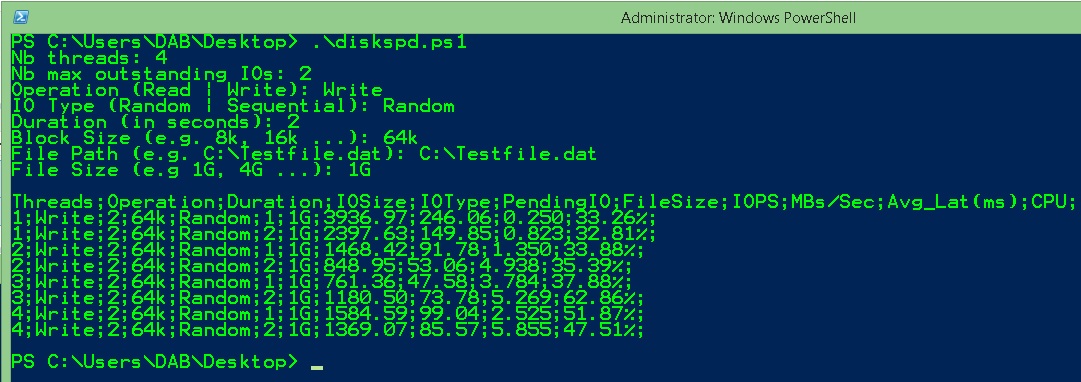
Finally I usually extracted the SQLIO result in a CSV format in order to create Excel charts for analysis and use them to discuss with the different infrastructure teams at customer places. Jose Baretto(Principa Program Manager at Microsoft) provides a good start in this blog and I’ m actually working on adding my touch to perform the same tasks with diskspd. Don’t be afraid because the below PowerShell script is a draft. Some improvements are necessary to reach a usable script.
$nb_threads = Read-Host "Nb threads";
$nb_outstanding = Read-Host "Nb max outstanding IOs";
$operation = Read-Host "Operation (Read | Write)";
$iotype = Read-Host "IO Type (Random | Sequential)";
$duration = Read-Host "Duration (in seconds)";
$blocksize = Read-Host "Block Size (e.g. 8k, 16k ...)";
$filepath = Read-Host "File Path (e.g. C:\Testfile.dat)";
$filesize = Read-Host "File Size (e.g 1G, 4G ...)";

$collect_data = @();
$collect_data = "Threads;Operation;Duration;IOSize;IOType;PendingIO;FileSize;IOPS;MBs/Sec;Avg_Lat(ms);CPU;`n";

#Threads
1..$nb_threads | % {
    $p_thread = $_;
    $thread = "-t$p_thread";

    #Outstanding
    1..$nb_outstanding | % {
        $p_outstanding = $_;
        $outstanding = "-o$p_outstanding";

        $p_filesize = "-c$filesize";
        $p_duration = "-d$duration";
        $p_blocksize = "-b$blocksize";

        if ($operation -eq "Read") { $p_operation = "-w0" }
        else { $p_operation = "-w100" };

        $p_iotype = "";
        if ($iotype -eq "Random") { $p_iotype = "-r" }
        else { $p_iotype = "" };

        $result = C:\DiskSpd\DiskSpd.exe $p_filesize $p_duration $p_operation $p_iotype $p_blocksize $thread $outstanding -h -L $filepath;


        foreach ($line in $result) {if ($line -like "total:*") { $total=$line; break } };
        foreach ($line in $result) {if ($line -like "avg.*") { $avg=$line; break } };
        $mbps = $total.Split("|")[2].Trim();
        $iops = $total.Split("|")[3].Trim();
        $latency = $total.Split("|")[4].Trim();
        $cpu = $avg.Split("|")[1].Trim();

        $collect_data += "$p_thread;$operation;$duration;$blocksize;$iotype;$p_outstanding;$filesize;$iops;$mbps;$latency;$cpu`n";
    }
}

Write-Host "";
Write-Host $collect_data;
My first result is not so bad:
We’ve seen some new features provided by diskspd compared to SQLIO. There are a plenty of other options and it is more than likely that I will write some other blog posts on this topic.
See you
By David Barbarin
![Thumbnail [60x60]](https://www.dbi-services.com/blog/wp-content/uploads/2022/12/microsoft-square.png)
![Thumbnail [90x90]](https://www.dbi-services.com/blog/wp-content/uploads/2022/08/NME_web-min-scaled.jpg)
![Thumbnail [90x90]](https://www.dbi-services.com/blog/wp-content/uploads/2024/01/HME_web.jpg)