As I said in my last blog, the Alfresco Summit 2014 took place in London from October 7 to 9. So yeah, unfortunately yesterday was the last day of this amazing event. It’s the first time I had the chance to participate in an Alfresco Summit but I’m quite sure it will not be the last! I can’t tell what moment I preferred during this event because the Keynote (presentation of Alfresco One 5.0) was very impressive and I really enjoyed it! All presentations were very interesting too but if I should pick just one thing, I think I would choose… The two evening parties :-D.
So more seriously, on the second day of conferences, I had the opportunity to attend a lot of sessions about best practices. The principal reason why I choose these kind of session is because I wanted to confront dbi services’ best practices about Alfresco to best practices of other Alfresco consultants (either Alfresco employees or Alfresco partners). Best practices sessions covered several different fields like:
- Security
- Performance
- Replication, Backup & Disaster Recovery
- Monitoring
- Sizing
- Aso…
Yesterday morning, I had the chance to attend to a session presented by Miguel Rodriguez (Technical Account Manager at Alfresco) about how to monitor an Alfresco installation. For the end of this blog, I will summarize the presentation of Miguel to show you how this solution is powerful! So the presentation wasn’t just about how to monitor a JVM, it was really more advanced because Miguel presented how to control all Alfresco environments (Dev, Test, Prod, aso…) in a single place with several tools.
The monitoring of Alfresco can be divided into three different categories:
- Monitoring and treatment of Alfresco logs
- Monitoring of the OS/JVM/Alfresco/Solr/Database
- Sending alerts to a group of people regarding the two categories above
I. Monitor and treat Alfresco logs
This first part about the monitoring and treatment of Alfresco logs needs three software:
- Logstash: it’s an utility that can be used to monitor events or log files and to execute little commands (like a “top”)
- ElasticSearch: this tool is able to index log files to do some restful search and analytics after that. This will be very useful for this part
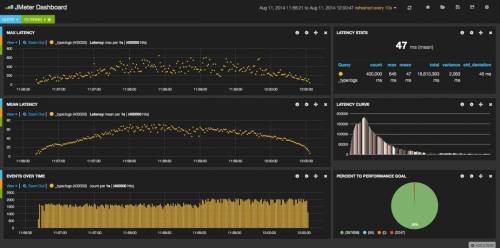
- Kibana3: the last software is the one used for the interface. It will just be used to query the index created by ElasticSearch and beautifully display the results. The Kibana3 page is composed of boxes fully customizable directly from the interface and that are refreshed automatically every X seconds (also customizable)
So here, we have a complete log monitoring & treatment solution. This solution can be used to display all errors in all alfresco log files in the last X secondes/minutes/hours, aso… But it can also be used to apply filters on all log files. For example, if you want to find all log entries related to “License”, then you just have to type “license” in the search box. As all log entries are indexed by ElasticSearch (using Lucene), then all boxes on the interface will be refreshed to only display data related to “license”.
 Image from Jeff Potts’ blog. This image display data related to JMeter but same results could be applied to Alfresco.
II. Monitoring of the OS/JVM/Alfresco/Solr/Database/…
This second part is as simple as the first one:
- Logstash: this time, logstash is more used to execute commands to retrieve numerical data. These commands can be Unix commands (e.g. “top” to retrieve current CPU consumption) but they can also be JMX commands to retrieve certain values from the JVM like free heap space. More details are available below.
- Graphite: this utility will just retrieve all numerical information generated by Logstash and then store them in a database
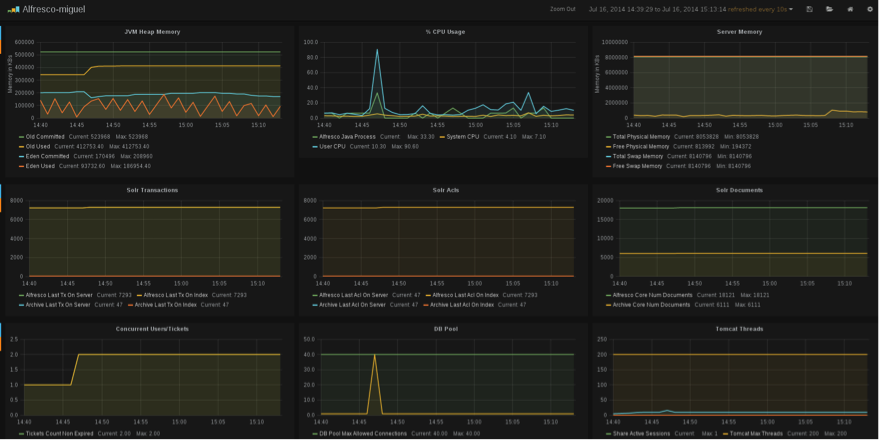
- Grafana: as above, this part need an interface… And in the same way, the page is fully customizable directly from the interface. You can add as many boxes (each box represent a diagram, often a line chart) as you want with as many information available in your database.
When I first saw the interface of Grafana, I thought “Oh, it looks like jconsole”. But this was really only my first impression. On this interface, you can add different boxes to display numerical data about not only one Alfresco Node but about all Alfresco Nodes! For example, you will be able to display boxes with the CPU consumption, memory consumption, the JVM heap size (permgen, used, free, aso…) and all these boxes will show data related to all Nodes of your cluster. All this kind of stuff is already available through jconsole. But in addition to what jconsole is capable of, you will be able to display boxes related to (non-exhaustive list):
- All database sessions available and all used
- Tomcat threads
- Disk i/o
- Alfresco documents in the repository and in Solr (Solr store documents in a different way)
- Health of the indexing: based on different values, we can know if the indexing is working well or if some tuning is required
- Index workers and tracking status: this chart show if there is a gap between the tracking of documents by Solr and the indexing of these documents which would means that Solr isn’t indexing at that time (probably an issue)
- Solr transactions
- Concurrent users
- Aso…
 Image extracted from the demonstration of Miguel Rodriguez
III. Sending alerts
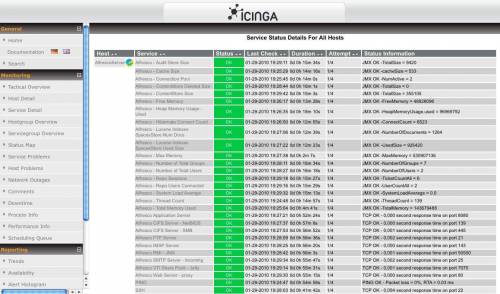
You are probably aware of some tools like Nagios that can be used to send alerts of different sorts. So let me present you a tool that you may not know: Icinga. This is the last tool that we will use for this monitoring solution and it’s pretty much the same thing that Nagios (it’s a fork of Nagios (2009)). With this tool, you are able to define some rules with a low threshold and a high threshold. If a threshold is reached, then the status of the rule is updated to Warning or Critical (e.g. Server Free Memory below 20% = Warning ; Server Free Memory below 10% = Critical). At the same time, an alert is sent to the group of people defined as contact in case of threshold reached. Well it’s pretty much the same thing that Nagios or other tools like that so I will not describe Icinga deeper.
 Image from Toni de la Fuente’s Blog
So here we are, we now have a lot of different tools used to provide a really good passive and active monitoring solution. But I hear your complaints from here about “Hey, there are way too much components to install, this is too difficult!”. Well let me finish! All tools above are Open Source tools and are available as a package created by Packer. This utility let you create a virtual machine “template” with all needed components pre-installed. So you are able to just download the package and after the execution of a single command, you will have a new virtual machine up and running with all monitoring components. The only remaining step is to install a Logstash agent on each components of Alfresco (Alfresco Nodes, Solr Nodes) and configure this agent to retrieve useful data.
I was really impressed by this session because Miguel Rodriguez showed us a lot of very interesting tools that I didn’t know. His monitoring solution looks really pretty well and I’m quite sure I will take some time to try it in the next few weeks.
I hope you have enjoyed this article as much as I enjoyed Miguel’s session and if you want to download your own version of this Monitoring VM, take a look at Miguel’s Github account.
![Thumbnail [60x60]](https://www.dbi-services.com/blog/wp-content/uploads/2022/08/MOP_web-min-scaled.jpg)
![Thumbnail [90x90]](https://www.dbi-services.com/blog/wp-content/uploads/2022/08/OLS_web-min-scaled.jpg)