By Franck Pachot
.
What is Aurora Serverless? That’s the RDS Aurora name for auto-scaling: instead of provisioning an instance size (from the burstable db.t3.small with 2 vCPU and 2GB RAM to db.r5.16xlarge with 64 vCPU and 512 GB RAM) you define a range in term of ACU /Aurora Capacity Unit). ACU is about CPU + RAM. This blog post will focus on RAM.
Aurora Serverless v1
In Serverless v1 the ACU goes from 1 (2 GB RAM) to 256 (488GB RAM) and the granularity is in power of two: each scale-up will double the instance. You can also opt for a minimum capacity of 0 where the instance is stopped when unused (no connections for 5 minutes), but then you accept that it takes few minutes for the first connection after that to startup again to the minimum capacity defined. Scaling happens on measured metrics like CPU (scale-up when >70%, down when <30%). The number of connections (percentage of max), and available RAM (but this is actually how the maximum number of maximum connections is calculated from the instance RAM. I don’t think the RAM threshold considers the usage of the shared buffer pool in serverless v1. Aurora tries to scale-up as soon as one threshold is reached, but scale-down requires both CPU and connections to be lower than the threshold, and scale-down cannot happen within 15 minutes after scale-up (the cooldown period). And, as scaling in Serverless v1 means stopping the database and starting it in another VM, it tries to do it outside of active connections and may timeout or force (your choice).
Serverless 1 will still be available. And there are currently some features that are not available in v2, like PostgreSQL compatibility or Data API. But they will come and I suppose v2 will replace v1 one day.
Aurora Serverless v2 (preview)
This new service has a finer grain of auto-scaling. With server’s virtualization, there’s the possibility to increase the number of vCPU on a VM without restart, and MySQL 5.7.5 can change the buffer pool online. And this gives a finer grain in scaling up and scaling down (announced 0.5 ACU gain), and without waiting. The preview goes from 4 ACU (8GB) to 32 (64GB) but the plan is that the minimum is as low as 0.5 ACU and up to 256 ACU. Then, you will probably not opt for stopping the instance, to avoid cold start latency, but keep it low at 0.5 ACU and then the database will be immediately available when a connection comes. And the granularity is by addition of 0.5 ACU rather than doubling the instance. So, even if the ACU is more expensive in v2, you probably consume less. And the scale-down doesn’t have to wait 15 minutes to cut by half the capacity as it can be decreased progressively online. Of course, having the instance restarted is still a possibility if there’s no vCPU available in the shared one, but that should not happen often.
Here is an example where I created a 8GB demo table:
--------------
create procedure demo(n int)
begin
 declare i int default 0;
 create table demo (id int not null primary key auto_increment, n int,x varchar(1000));
 insert into demo(n,x) values (1,lpad('x',898,'x'));
 while i < n do
  set i = i + 1;
  insert into demo(n,x) select n,x from demo;
  commit;
 end while;
end
--------------

--------------
call demo(23)
--------------
VM movement
During this creation I experienced multiple scale down (after the instance creation) and up (during the table row ingestion) and you can see that in this case the VM was probably moved to another server and had to restart. The “Engine Uptime” in CloudWatch testifies from the restarts and “Serverless Database Capacity” i the ACU (capacity units):
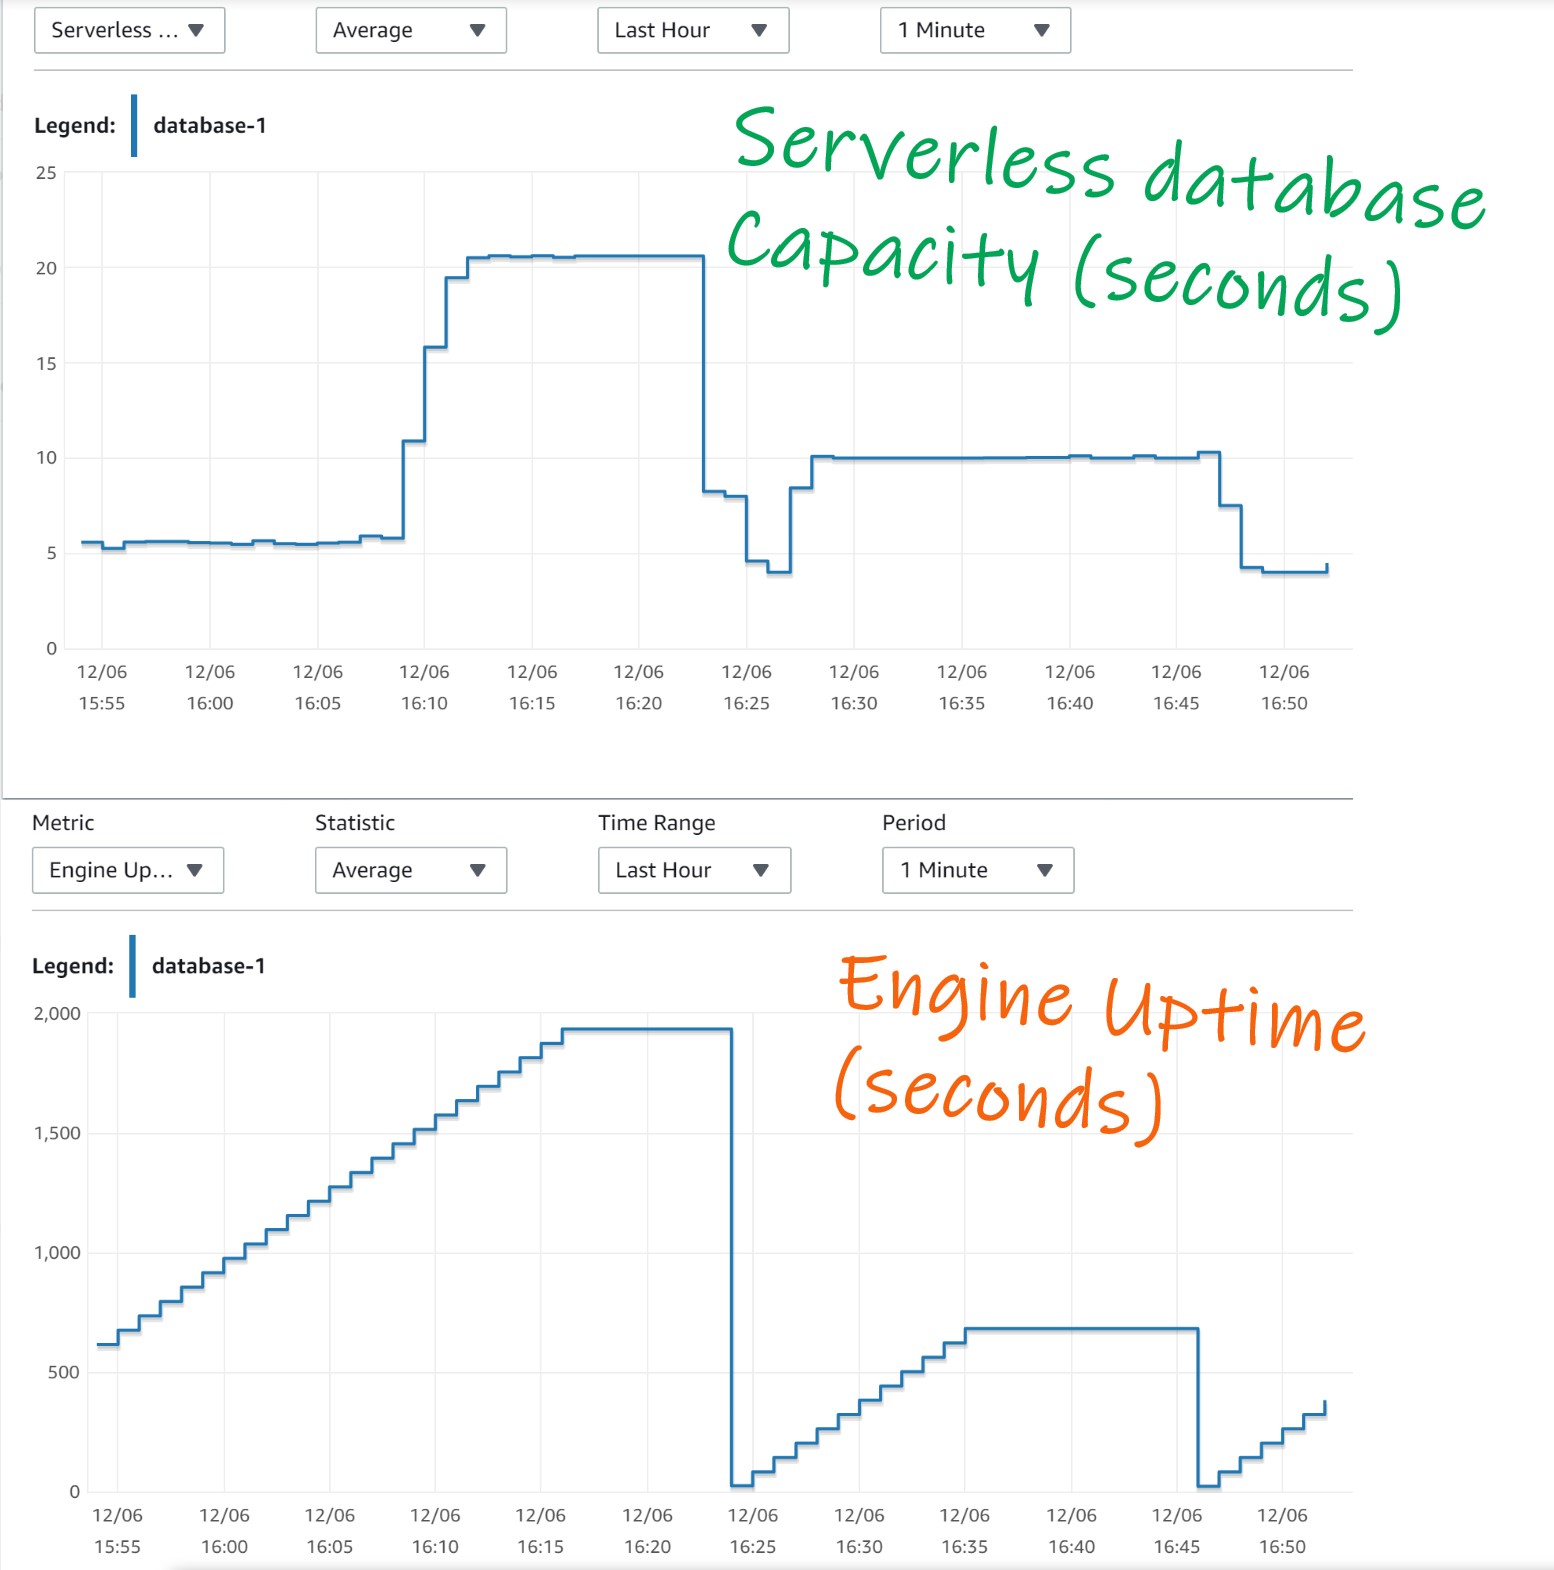
During those VM movements, I got this kind of error:
ERROR 2013 (HY000) at line 29: Lost connection to MySQL server during query
You just have to retry in this case. If you can’t then you will set some minimum/maximum ACU or maybe go to a provisioned database.
--------------
analyze table demo
--------------
Table           Op       Msg_type   Msg_text
-----------     -------  --------   --------
franck.demo     analyze  status     OK

--------------
select round(data_length/1024/1024) TABLE_MB,round(index_length/1024/1024) INDEX_MB,table_rows,table_name,table_type,engine from information_s
chema.tables where table_schema='franck'
--------------

TABLE_MB  INDEX_MB        table_rows      table_name      table_type      engine
--------  --------        ----------      ----------      ----------      ------
    8200         0           7831566            demo      BASE TABLE      InnoDB
Here I checked the size of my table: about 8GB.
buffer pool
I mentioned vCPU but what about RAM? The VM memory can also be resized online but there’s a difference. With CPU, if you scaled-down too early, it can scale-up immediately and you get back to the previous performance. But when you do that with RAM you have evicted some data from the caches that will not be back immediately until the first sessions warms it up again. So, the Serverless v2 has to look at the InnoDB LRU (Least Recently Used) buffers to estimate the risk to drop them. I mention InnoDB because for the moment Aurora Serverless v2 is on the MySQL compatibility only.
On my DEMO table I’ve run the following continuously:
use franck;
set profiling = 1;
select count(*) from demo where x='$(date) $RANDOM';
show profiles;
I’ve run that in a loop, so one session continuously active reading 8GB (the predicate does not filter anything and is there just to run a different query each time as I want to show the effect on the buffer pool and not the query cache).
Then, from 18:00 to 18:23 approximately I have run another session:
use franck;
delimiter $$
drop procedure if exists cpu;
create procedure cpu()
begin
 declare i int default 0;
 while 1  do
  set i = i + 1;
 end while;
end$$
delimiter ;
call cpu();
Please, don’t judge me on my MySQL procedural code 😉 I’m just looping in CPU
Then after 20 minutes:
MySQL [(none)]> show full processlist;

--------------
show full processlist
--------------

+-----+----------+--------------------+--------+---------+------+--------------+------------------------------------------------------------------------+
| Id  | User     | Host               | db     | Command | Time | State        | Info                                                                   |
+-----+----------+--------------------+--------+---------+------+--------------+------------------------------------------------------------------------+
|  42 | admin    | 192.169.29.1:22749 | franck | Query   |    0 | NULL         | call cpu()                                                             |
| 302 | rdsadmin | localhost          | NULL   | Sleep   |    1 | NULL         | NULL                                                                   |
| 303 | rdsadmin | localhost          | NULL   | Sleep   |    0 | NULL         | NULL                                                                   |
| 304 | rdsadmin | localhost          | NULL   | Sleep   |    0 | NULL         | NULL                                                                   |
| 305 | rdsadmin | localhost          | NULL   | Sleep   |    0 | NULL         | NULL                                                                   |
| 339 | admin    | 192.169.29.1:30495 | NULL   | Query   |    0 | starting     | show full processlist                                                  |
| 342 | admin    | 192.169.29.1:42711 | franck | Query   |    3 | Sending data | select count(*) from demo where x='Sun Dec  6 18:23:25 CET 2020 28911' |
+-----+----------+--------------------+--------+---------+------+--------------+------------------------------------------------------------------------+
7 rows in set (0.00 sec)

MySQL [(none)]> kill 42;
--------------
kill 42
--------------
I’ve stopped my running loop.
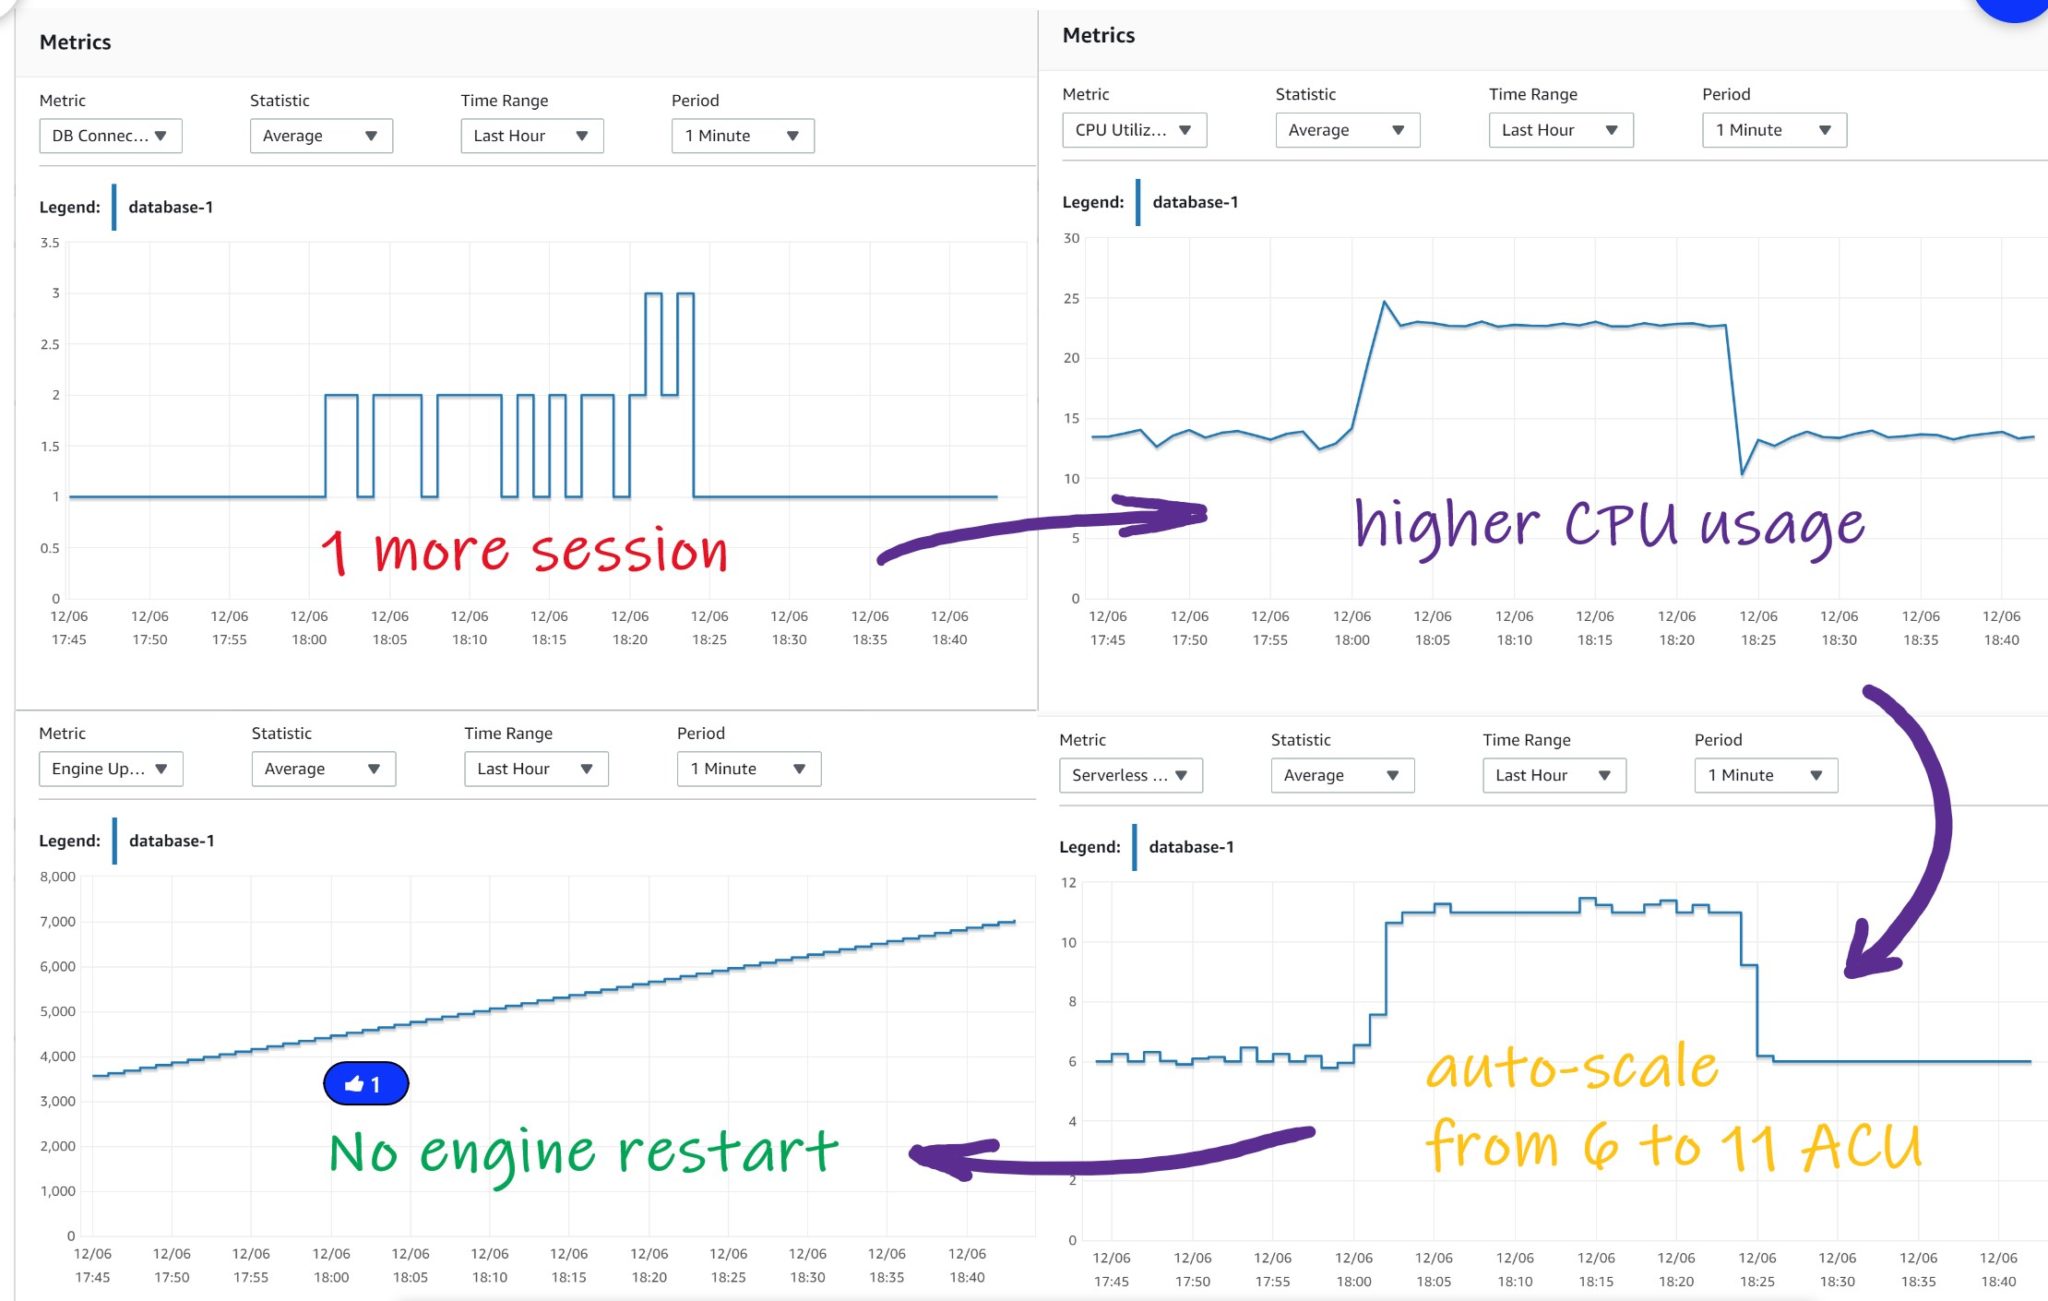
And here is what I can see from CloudWatch:
- DB Connection: I always have one busy connection most of the time for the repeated scans on DEMO. And during 20 minutes a second one (my CPU procedure). The third one at the end is when I connected to kill the session
- Serverless Database Capacity: this is the number of ACU. The value was 6 when only the scan was running, and scaled-up to 11 when the CPU session was running
- CPU Utilization (Percent): this is the percentage on the number of OS threads. 13.6% when only the scan session was running, and reached 23% during the additional CPU run. Note that the number of OS threads was not increased when ACU scaled from 6 to 11… I’ll come back on that later
- Engine Uptime: increasing by 1 minute every minute, this means that all scale up/down was done without a restart of the engine
Now, something that you don’t see in CloudWatch metrics, is the response time for my DEMO table scan.
Dec 06 17:52:37 1       79.03579950     select count(*) from demo where x='Sun Dec  6 17:51:17 CET 2020 13275'
Dec 06 17:53:59 1       79.83154300     select count(*) from demo where x='Sun Dec  6 17:52:37 CET 2020 4418'
Dec 06 17:55:20 1       79.81895825     select count(*) from demo where x='Sun Dec  6 17:53:59 CET 2020 11596'
Dec 06 17:56:40 1       78.29040100     select count(*) from demo where x='Sun Dec  6 17:55:20 CET 2020 25484'
Dec 06 17:58:02 1       80.15728125     select count(*) from demo where x='Sun Dec  6 17:56:40 CET 2020 15321'
Dec 06 17:59:42 1       98.29309550     select count(*) from demo where x='Sun Dec  6 17:58:02 CET 2020 31126'
Dec 06 18:01:09 1       85.07732725     select count(*) from demo where x='Sun Dec  6 17:59:42 CET 2020 29792'
Dec 06 18:02:30 1       79.16154650     select count(*) from demo where x='Sun Dec  6 18:01:09 CET 2020 21930'
Dec 06 18:02:34 1       2.81377450      select count(*) from demo where x='Sun Dec  6 18:02:30 CET 2020 12269'
Dec 06 18:02:38 1       2.77996150      select count(*) from demo where x='Sun Dec  6 18:02:34 CET 2020 30306'
Dec 06 18:02:42 1       2.73756325      select count(*) from demo where x='Sun Dec  6 18:02:38 CET 2020 22678'
Dec 06 18:02:47 1       2.77504400      select count(*) from demo where x='Sun Dec  6 18:02:42 CET 2020 933'
Dec 06 18:02:51 1       2.73966275      select count(*) from demo where x='Sun Dec  6 18:02:47 CET 2020 21922'
Dec 06 18:02:56 1       2.87023975      select count(*) from demo where x='Sun Dec  6 18:02:51 CET 2020 9158'
Dec 06 18:03:00 1       2.75959675      select count(*) from demo where x='Sun Dec  6 18:02:56 CET 2020 31710'
Dec 06 18:03:04 1       2.72658975      select count(*) from demo where x='Sun Dec  6 18:03:00 CET 2020 27248'
Dec 06 18:03:09 1       2.71731325      select count(*) from demo where x='Sun Dec  6 18:03:04 CET 2020 18965'
More than one minute to scan those 8GB, that’s 100 MB/s which is what we can expect from physical reads. 8GB doesn’t fit in a 6 ACU instance. Then, when I started another session, which triggered auto-scaling to 11 ACU, the memory became large enough and this is why my response time for the scan is now less than 3 seconds. I mentioned that I’d come back on CPU usage because that’s not easy to do the maths without looking at the OS. I think that this will deserve another blog post. I have seen 13.6% of CPU Utilization when the count was running alone in CPU. There were I/O involved here, but as far as I know 13.6% on 6 ACU is the equivalent of one sessions running in CPU. So probably the scan was not throttled by I/O? Then I added another session, which I know was running fully in CPU, and the scan was also running fully in CPU (all from buffer pool) between the connection time. I had 23% CPU Utilization and I think that in a 11 ACU scale, 2 sessions fully on CPU take 26%. I’ll do other test to try to confirm this. I miss Performance Insight here to get the real picture…
Then, as you have seen that scale-down happened when I stopped my concurrent session, you can imagine the response time:
Dec 06 18:24:23 1       3.03963650      select count(*) from demo where x='Sun Dec  6 18:24:17 CET 2020 2815'
Dec 06 18:24:27 1       2.80417800      select count(*) from demo where x='Sun Dec  6 18:24:23 CET 2020 16763'
Dec 06 18:24:31 1       2.77208025      select count(*) from demo where x='Sun Dec  6 18:24:27 CET 2020 29473'
Dec 06 18:24:36 1       3.13085700      select count(*) from demo where x='Sun Dec  6 18:24:31 CET 2020 712'
Dec 06 18:24:41 1       2.77904025      select count(*) from demo where x='Sun Dec  6 18:24:36 CET 2020 17967'
Dec 06 18:24:45 1       2.76111900      select count(*) from demo where x='Sun Dec  6 18:24:41 CET 2020 20407'
Dec 06 18:24:49 1       2.79092475      select count(*) from demo where x='Sun Dec  6 18:24:45 CET 2020 7644'
Dec 06 18:26:17 1       85.68287300     select count(*) from demo where x='Sun Dec  6 18:24:49 CET 2020 691'
Dec 06 18:27:40 1       81.58135400     select count(*) from demo where x='Sun Dec  6 18:26:17 CET 2020 14101'
Dec 06 18:29:02 1       80.00523900     select count(*) from demo where x='Sun Dec  6 18:27:40 CET 2020 31646'
Dec 06 18:30:22 1       78.79213700     select count(*) from demo where x='Sun Dec  6 18:29:02 CET 2020 811'
Dec 06 18:31:42 1       78.37765950     select count(*) from demo where x='Sun Dec  6 18:30:22 CET 2020 24539'
Dec 06 18:33:02 1       78.64492525     select count(*) from demo where x='Sun Dec  6 18:31:42 CET 2020 789'
Dec 06 18:34:22 1       78.36776750     select count(*) from demo where x='Sun Dec  6 18:33:02 CET 2020 2321'
Dec 06 18:35:42 1       78.38105625     select count(*) from demo where x='Sun Dec  6 18:34:22 CET 2020 27716'
Dec 06 18:37:04 1       79.74060525     select count(*) from demo where x='Sun Dec  6 18:35:42 CET 2020 487'
Yes, down to 6 ACU, the buffer pool is shrinked, back to physical I/O…
This is the risk when CPU and RAM are scaled in proportion: a single-thread may not have enough RAM in order to save on CPU. And, paradoxically, can get more when there are more concurrent activity. Here is the kind of scenario I would not like to encounter:
Yes. That, and estimating the cost of warming-up the cache when the scale-up needs to move the VM and restart the engine. Didn't test it but I foresee: higher load -> scale up -> move VM -> more I/O -> less CPU% (until cache warmed up) –> a scale down here would be a bad idea.
— Franck Pachot (@FranckPachot) December 6, 2020
ACU and Buffer Pool size
I’ve seen 0 ACU only during the creation, but in this preview there is no “pause” option and we can go only between 4 and 32 ACU.
I have tested all of them to check the related settings. You see ACU and max_connections in x-axis, and VM size as well as the buffer size and query cache size:
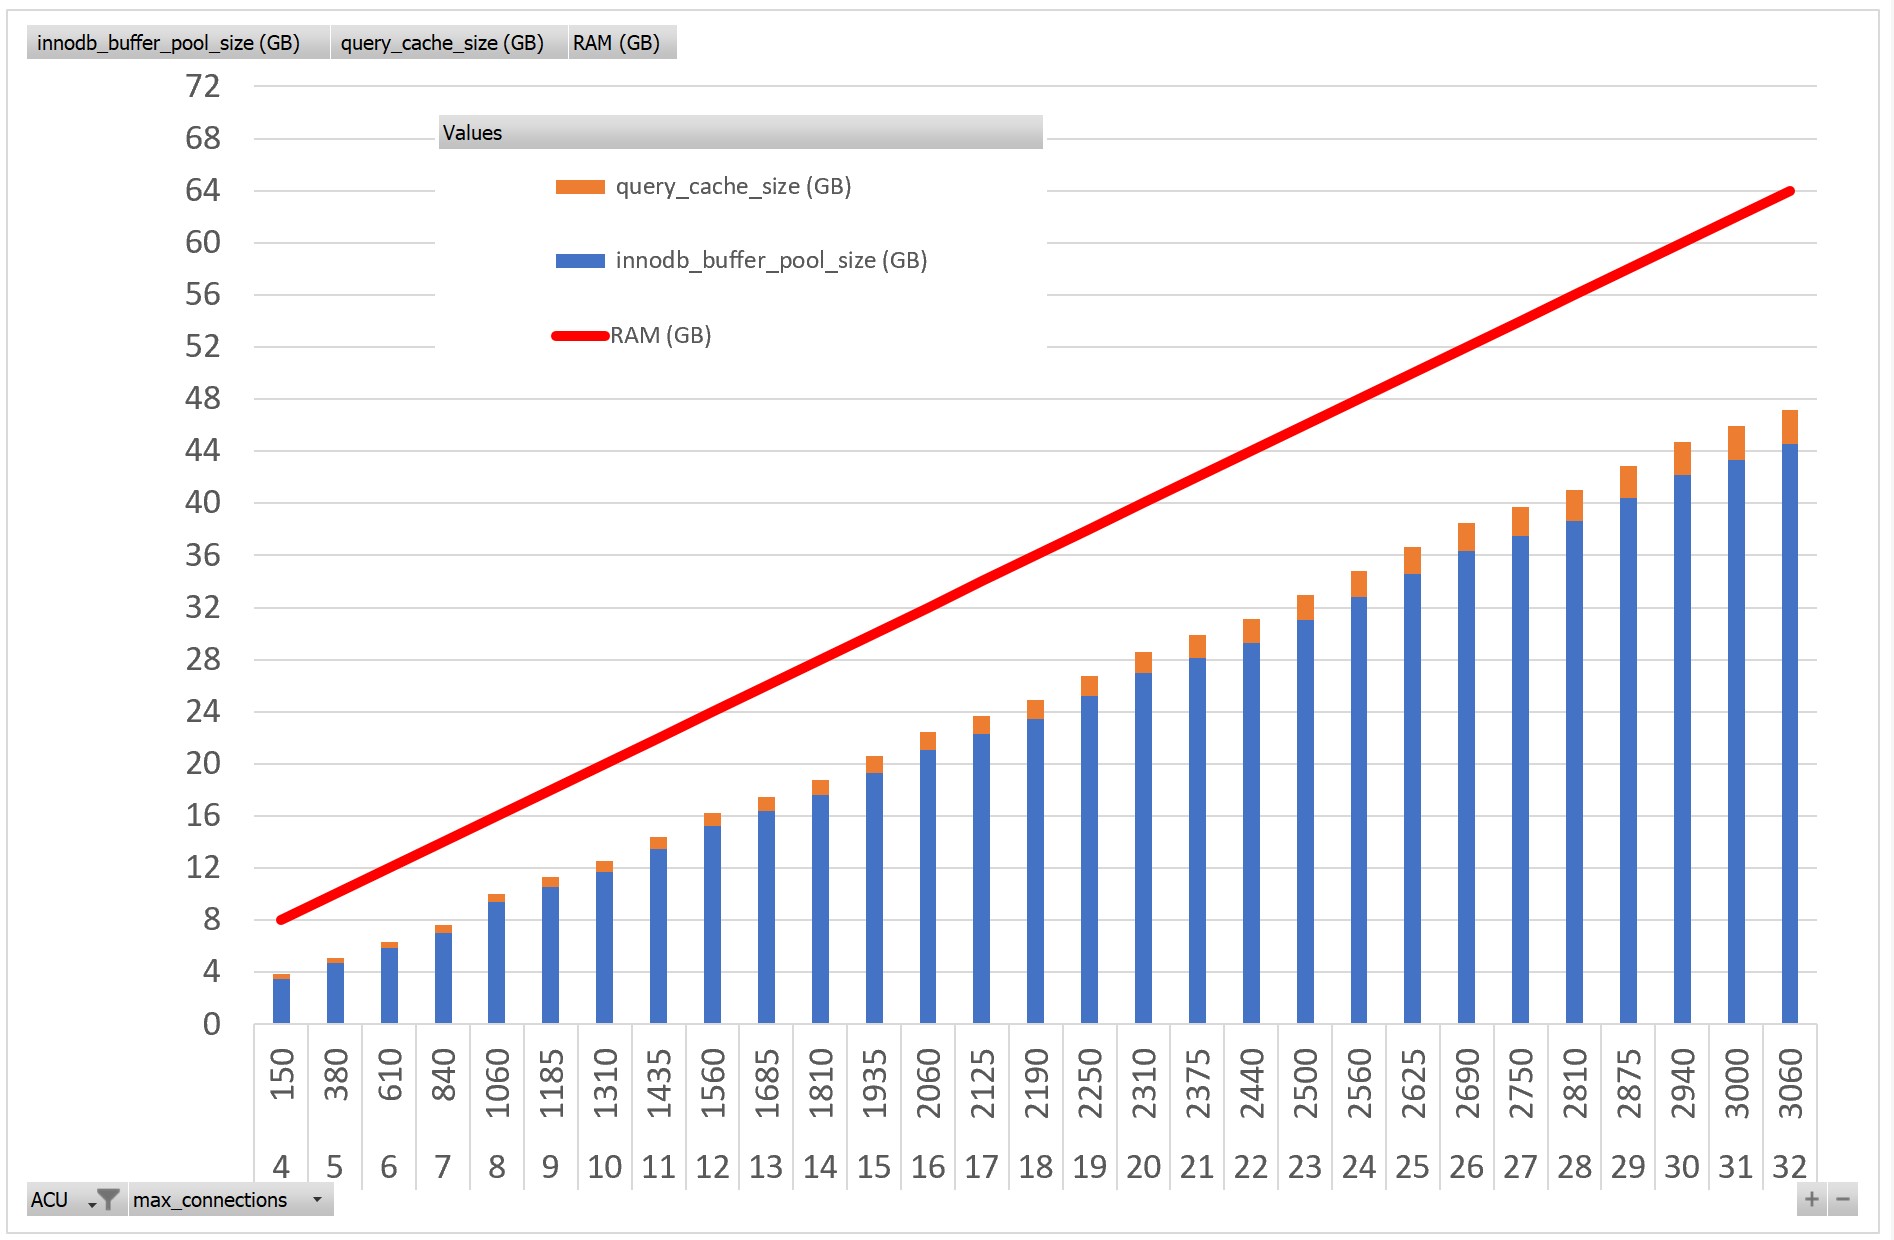
Here you see what happened with my 8GB demo table, it didn’t fit in a 6 ACU shape where the buffer pool is 6GB but stayed in memory in the 11 ACU shape with 13.5 GB.
Among the interesting buffer pool settings that are different in Serverless:
--------------
show global variables like '%innodb%buffer_pool%'
--------------

Variable_name   Value
innodb_buffer_pool_chunk_size   157286400
innodb_buffer_pool_dump_at_shutdown     OFF
innodb_buffer_pool_dump_now     OFF
innodb_buffer_pool_dump_pct     25
innodb_buffer_pool_filename     ib_buffer_pool
innodb_buffer_pool_instances    8
innodb_buffer_pool_load_abort   OFF
innodb_buffer_pool_load_at_startup      OFF
innodb_buffer_pool_load_now     OFF
innodb_buffer_pool_size 3774873600
innodb_shared_buffer_pool_uses_huge_pages       OFF
--------------
Huge pages are off in Serverless. This innodb_shared_buffer_pool_uses_huge_pages is not a MySQL but an Aurora specific one which is ON with the provisioned flavor of Aurora, but off in serverless. This makes sense given how Serverless can allocate and de-allocate memory.
ACU and CPU
As I mentioned, this deserves a new blog post. Amazon does not give the ACU – vCPU equivalence. And, given the CPU Utilization percentages I see, I don’t think that the VM is resized. Except when we see that the engine is restarted.
The price
About the price, I let you read Jeremy Daly analysis: https://www.jeremydaly.com/aurora-serverless-v2-preview/
My opinion… serverless is a feature that the cloud provider gives you to lower their revenue. Then, of course, it has to be more expensive. The cloud provider must keep a margin of idle CPU in order to face your scale-out without moving the VM (taking more time and flushing memory, which compromises availability). You pay more when busy, but you save on idle time without risking saturation at peak.
And anyway, don’t forget that Serverless is an option. It may fit your needs or not. If you don’t want the buffer pool effect that I’ve described above, you can provision an instance where you know exactly how much RAM you have. And… don’t forget this is preview, like beta, and anything can change. Next post gives more details about CPU Utilization: https://www.dbi-services.com/blog/aurora-serverless-v2-cpu/
![Thumbnail [90x90]](https://www.dbi-services.com/blog/wp-content/uploads/2022/08/ADE_WEB-min-scaled.jpg)
![Thumbnail [90x90]](https://www.dbi-services.com/blog/wp-content/uploads/2022/10/ELU_web-min-1-scaled.jpg)
![Thumbnail [90x90]](https://www.dbi-services.com/blog/wp-content/uploads/2022/12/oracle-square.png)
![Thumbnail [90x90]](https://www.dbi-services.com/blog/wp-content/uploads/2022/11/NIJ-min-scaled.jpg)