By Franck Pachot
.
You have a query that takes too long and you want help to analyze the execution plan? Then you need to get it with relevant information, and correctly formatted. Autotrace is not a good option as it does not bind the variables in the same way as your application. Explain plan only shows estimations, but if we have a performance issue, this probably means that the estimation is wrong. I prefer SQL Monitoring when we have Tuning Pack, or the cursor plan with row-source statistics in all other cases. If you post it in a forum, don’t forget to keep it formatted or it’s impossible to read.
Here are the two ways I prefer to get an execution plan, depending on whether you have the tuning pack licence or not.
Method 1 – Without Tuning Pack
I set the sqlplus environment to nicely spool to text file and set the STATISTICS_LEVEL to ALL in order to gather plan execution statistics:
set pagesize 10000 linesize 300 trimspool on serveroutput off
alter session set statistics_level=all;
Then I execute the query. Don’t forget to set the current_schema to the user that executes the statement, and to bind variables:
-- set the schema
alter session set current_schema=SCOTT;
-- define variables
variable minimum_salary number
-- bind values
exec :minimum_salary := 3000
-- execute the query
SELECT * FROM DEPT JOIN EMP USING(DEPTNO) WHERE SAL>:minimum_salary;
Finally I get the execution plan to a text file:
spool plan.txt
select * from table(dbms_xplan.display_cursor(format=>'allstats last +outline +peeked_binds +cost'));
spool off
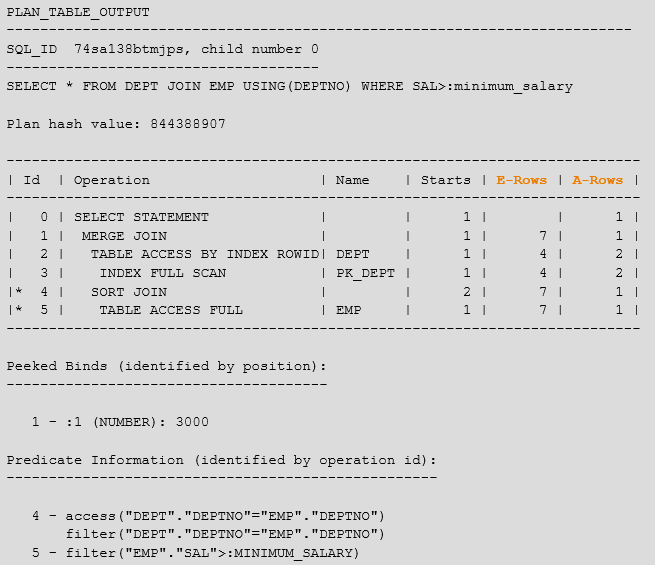
The plan will have both the estimations (E-Rows) and the actual number of rows (A-Rows) from the last execution. Note that if it is a parallel query statement, you must omit the ‘last’ in the format or you will have statistics only for the coordinator process.
Method 2 – With Tuning Pack
When you have tuning pack, you have access to the great SQL monitoring feature.
SQL> show parameter pack
NAME                                 TYPE        VALUE
 ------------------------------------ ----------- ------------------------------
 control_management_pack_access       string      DIAGNOSTIC+TUNING
I set the sqlplus environment to nicely spool to html file:
set pagesize 0 linesize 10000 trimspool on serveroutput off long 1000000 longc 1000000 echo off feedback off
Then I execute the query. Don’t forget to set the current_schema to the user that executes the statement, and to bind variables.
One difference here: the MONITOR hint to force SQL Monitoring.
-- set the schema
alter session set current_schema=SCOTT;
-- define variables
variable minimum_salary number
-- bind values
exec :minimum_salary := 3000
-- execute the query
SELECT /*+ monitor */ * FROM DEPT JOIN EMP USING(DEPTNO) WHERE SAL>:minimum_salary;
Finally, get the execution plan to a html file:
-- in 12c avoid compression of xml because there is additional information:
alter session set events='emx_control compress_xml=none';
-- errors with French NLS_LANG
alter session set NLS_NUMERIC_CHARACTERS=',.';
spool plan.htm
select dbms_sqltune.report_sql_monitor(report_level=>'all',type=>'active') from dual;
spool off
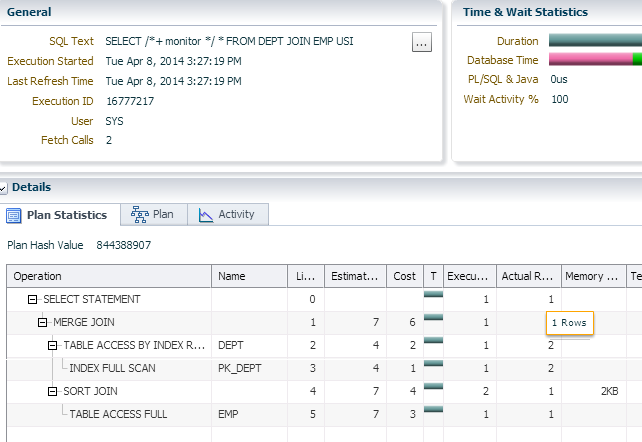
The html file is very small but will be rendered by an online flash automatically loaded from the oracle.com website.
You can see both output, plan.txt, and plan.htm from this zip: xplans.zip
Here is how they look like (but please never send me screenshots of execution plans…):
And the colorful active report from SQL Monitoring:
The goal of this blog post is to simply (copy/paste) the formatting and the plan gathering code, so if you have any improvement ideas, please share.
Update 25-JUL-2014
Thanks to Tyler Muth (@tmuth) I added the emx_control event to avoid compression of xml in 12c. See his Query Test Framework


![Thumbnail [60x60]](https://www.dbi-services.com/blog/wp-content/uploads/2022/12/oracle-square.png)
![Thumbnail [90x90]](https://www.dbi-services.com/blog/wp-content/uploads/2022/08/DWE_web-min-scaled.jpg)
![Thumbnail [90x90]](https://www.dbi-services.com/blog/wp-content/uploads/2022/08/JDU_web-min-scaled.jpg)