BI Publisher offers you the possibility to create your own custom reports, I will describe you how to create a report displaying the tablespace size and used size in a simply way.
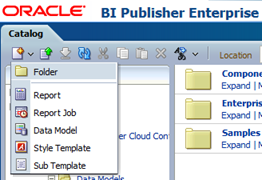
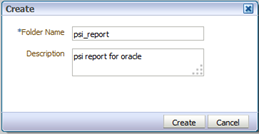
It is advised to create a specific folder in which we will create our reports, because in case of upgrade you won’t lose your BI reports. In the catalog window, you select create folder:
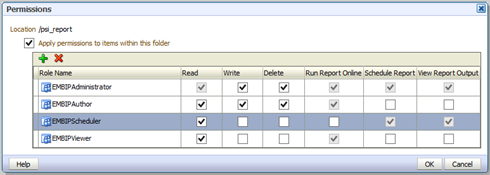
We have to grant permissions to this folder to Enterprise Manager Users who will have access to this report; we give Read, Write, Delete access to the user with the EMBIPAuthor role, and only Read access to the EMBIPViewer, we also select Apply permissions to items within this folder:
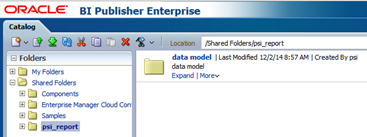
We also create a data model folder in the psi_report folder and we also grant the adequate permissions to the users:
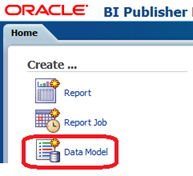
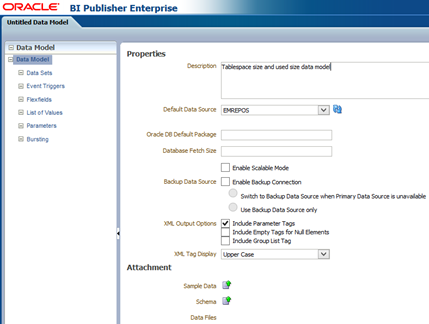
Now we can create the data model:
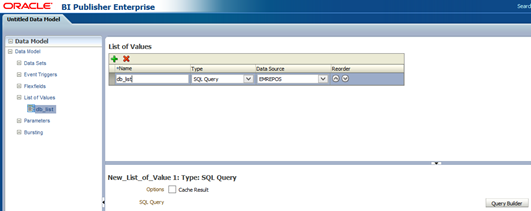
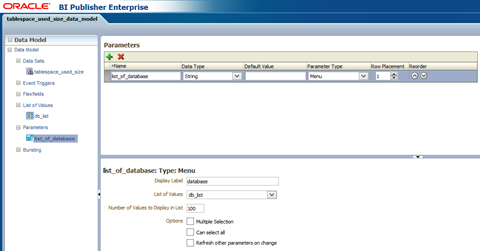
What do we need? We need a list of values (for the list of database instance), a parameter (the name of the database):
We select list of value to define the database list and we select Query Builder:
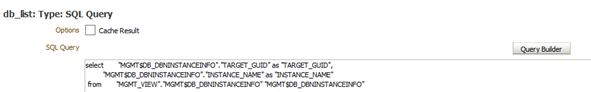
You have access to all the mgmt$ sysman’s view of the Enterprise Manager repository. You select for example the mgmt$dbninstanceview and the fields target_guid and instance_name:
The query is automatically generated:
Now we add parameters :
Once we have created a list of values and parameters, we can create a data set:
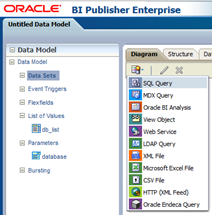
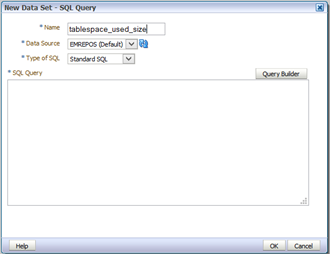
You select SQL Query, you give a name for the data set and you select Query Builder:
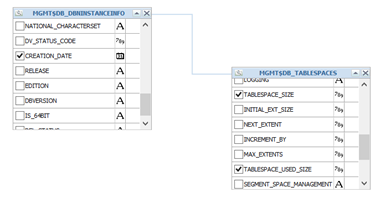
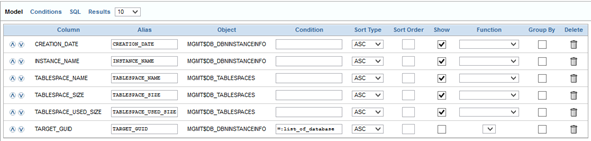
In the query builder, you select the mgmt$dbninstance and mgmt$db_tablespaces. By selecting in the right case of the field TARGET_GUID, we select the column for join, the we select the other columns we need, such as tablespace_size and tablespace_used_size:
You select the condition field in the Query Builder windows in order to add a condition to the target_guid with the list_of_database parameter:
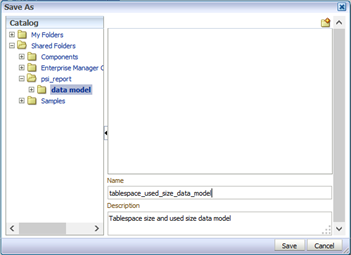
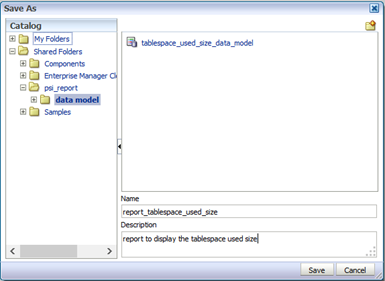
We save the data model in the psi_report/data model folder:
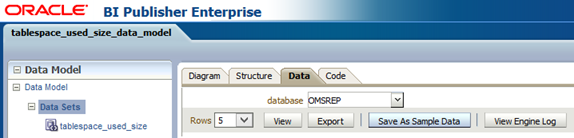
You also have to save the data model as Sample Data:
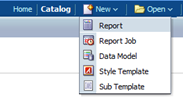
Finally we can create a new report:
We select an existing Data Model:
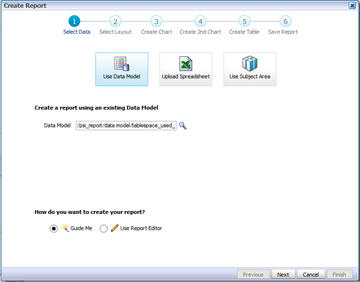
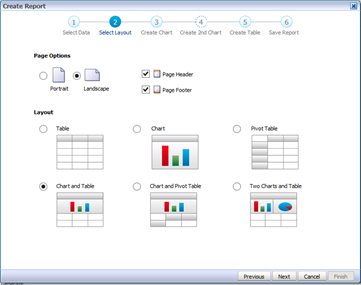
We can select different options:
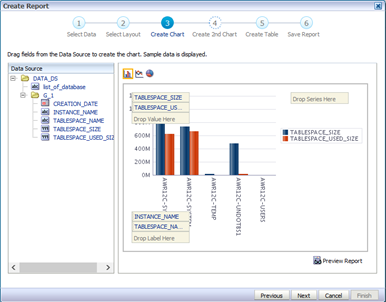
You build your report by selecting the different fields, and pushing them in the right window:
Finally you save the report file:
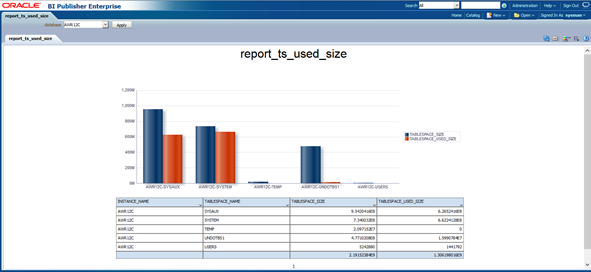
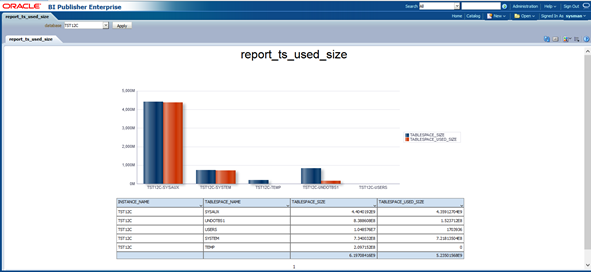
Your report is ready to be visualized; selecting the instance name from the menu allows you to visualize the report for each database instance:
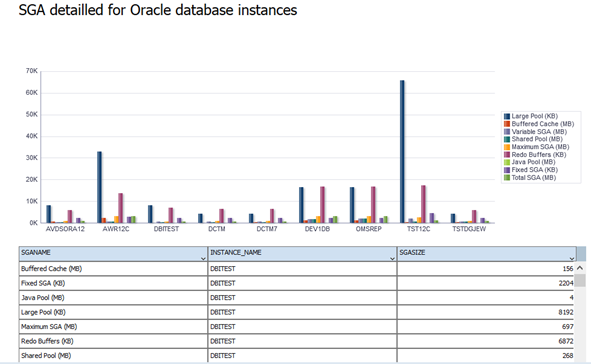
As we have access to the repository views,there are a lot of possibilities to create reports about CPU, SGA, AVAILIBILITY_HISTORY, ALERT_HISTORY, COMPLIANCE, aso…:
For example, it is quite easy to display the SGA details of ou database instances in a few minutes:
The BI Publisher environment allows the report scheduling, there is also the possibilty to receive those reports by mail. BI Publisher reporting is a very powerful tool allowing Oracle DBAs to generate reports displaying the overall architecture of their environment.
![Thumbnail [60x60]](https://www.dbi-services.com/blog/wp-content/uploads/2022/12/oracle-square.png)
![Thumbnail [90x90]](https://www.dbi-services.com/blog/wp-content/uploads/2022/08/DWE_web-min-scaled.jpg)