As an Oracle DBA I use Enterprise Manager to monitor Oracle databases at my client’s sites. I also administer more and more Postgres databases. I decided to download the Blue Medora plugin in order to monitor the postgresql databases with Enterprise Manager 13c, and to avoid to have different monitoring tools for each kinf of database.
Once you have downloaded the Blue Medora plugin for EM13c, you have to unzip it:
oracle@vmtestoraCC13c:/home/oracle/psi/ [rdbms12102] unzip bm.em.xpgs_12.1.0.2.0_2.0.3.zip
Archive:  bm.em.xpgs_12.1.0.2.0_2.0.3.zip
  inflating: bm.em.xpgs_12.1.0.2.0_2.0.3.opar
......
Then like other plugins, you have to import it in the OMS (Oracle Management Server):
oracle@vmtestoraCC13c:/home/oracle/psi/ [oms13c] emcli import_update
 -file=/home/oracle/psi/bm.em.xpgs_12.1.0.2.0_2.0.3.opar -omslocal
Processing update: Plug-in - PostgreSQL Monitoring
Successfully uploaded the update to Enterprise Manager.
Use the Self Update Console to manage this update.
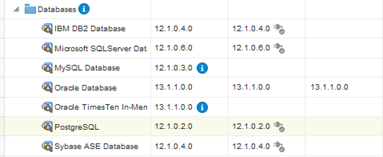
Once imported, from the Extensibility plugin page, we can display the PostgreSQL plugin:
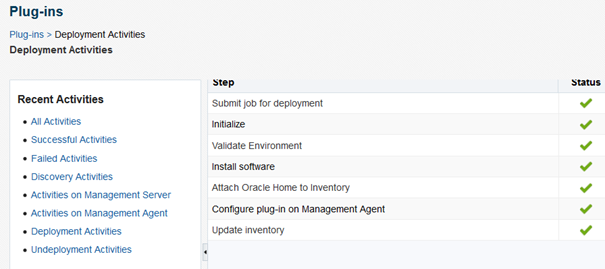
We have to deploy the plugin to the OMS:
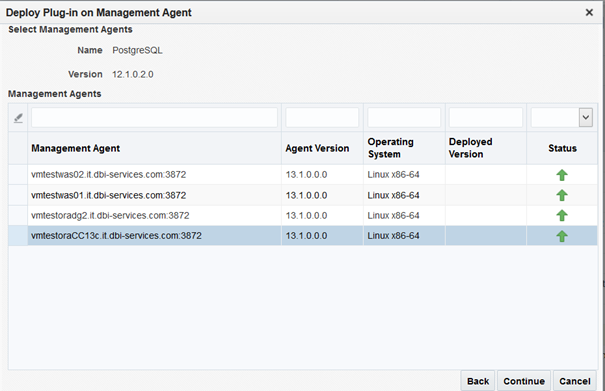
The next step consists now to deploy the plugin on an agent where there is an existing postgres environment, we select the adequate agent and we select Continue:
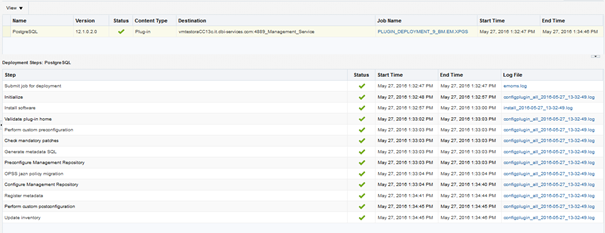
The postgresql plugin is successfully deployed to the agent:
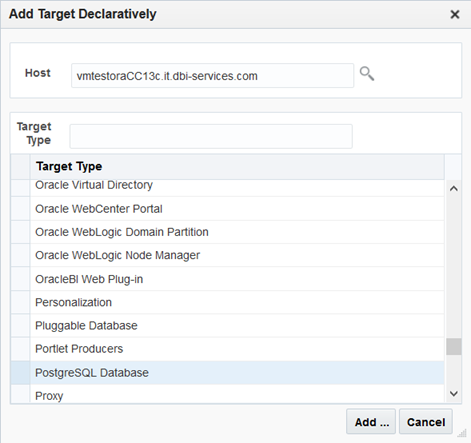
Once the plugin is deployed, we need to add a postgres database target. I used the Add Target Declaratively and choosed Postgresql Database as Target Type:
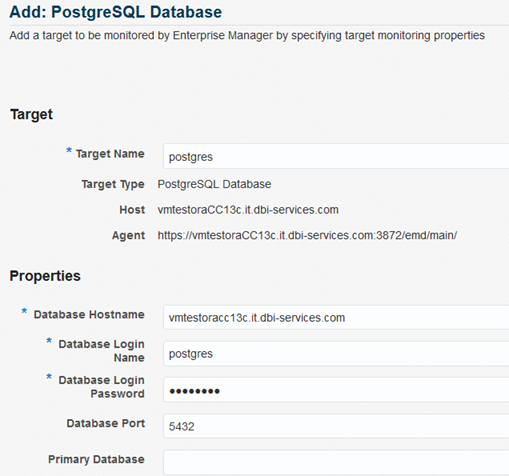
In the next screen you enter the target name and useful informations such as hostname, login, password and port number:
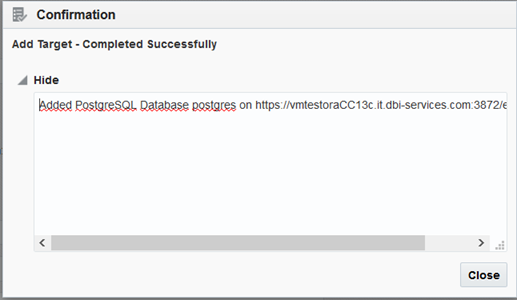
Finally the postgresql database target has been added successfully:
Once the configuration phase finished, let’s have a look over how EM13c works with postgresql !
The newly postgresql database target exist in EM13c:
We have the same menus as we are used for Oracle database targets:
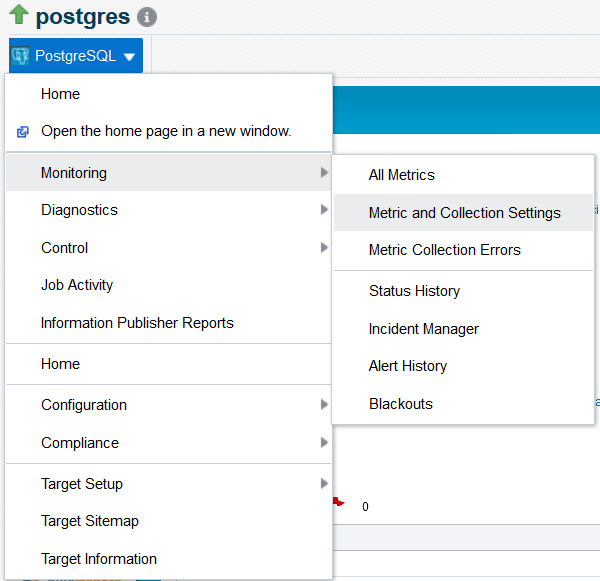
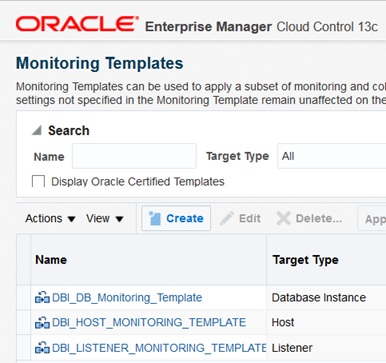
Now let’s try to create a monitoring template for postgresql database. From the EM13c Monitoring template menu, choose create:
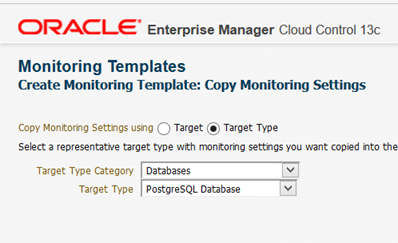
Choose Target Type and select PosgreSQL database:
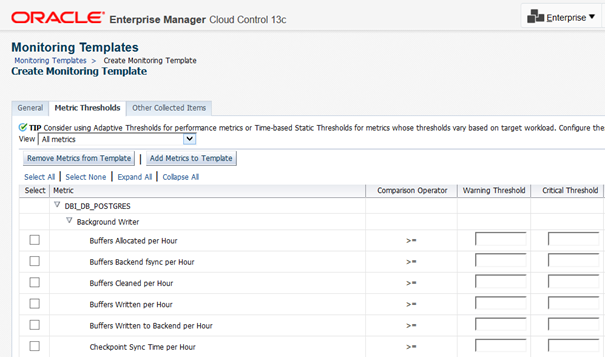
Enter the monitoring template name and a description:
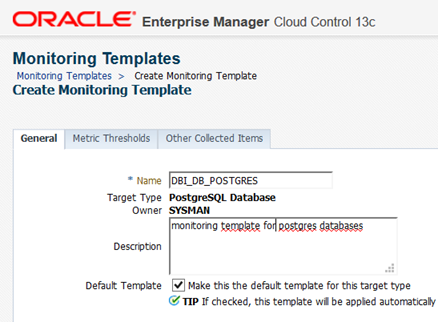
You have the possibility to define thresholds for metrics:
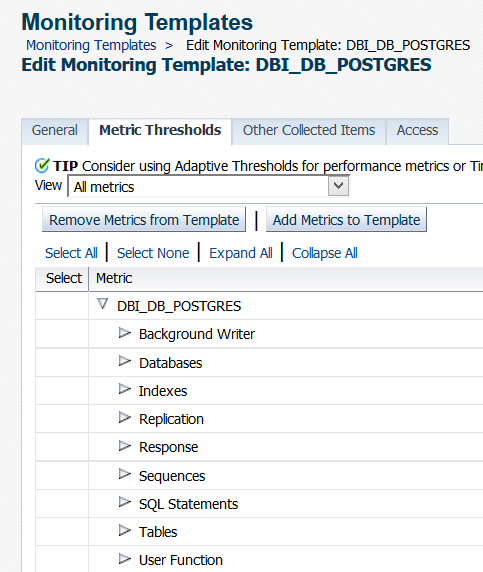
Select Ok and the DBI_DB_POSTGRES is created.
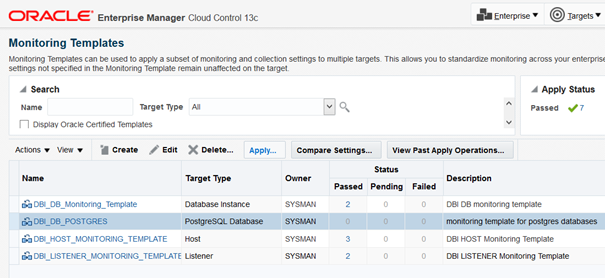
Finally we apply the template to our postgres database as follows, we select the postgressql database and we select Apply:
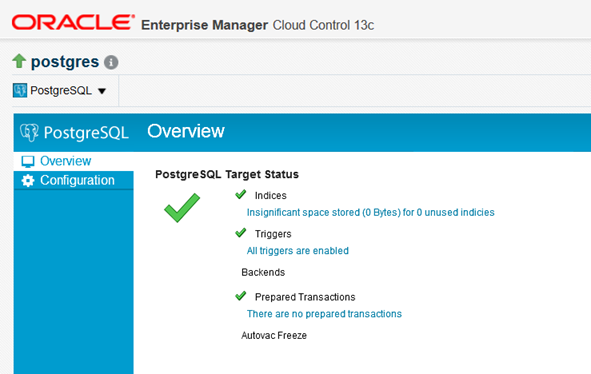
The Home postgres EM13c page displays more informations:
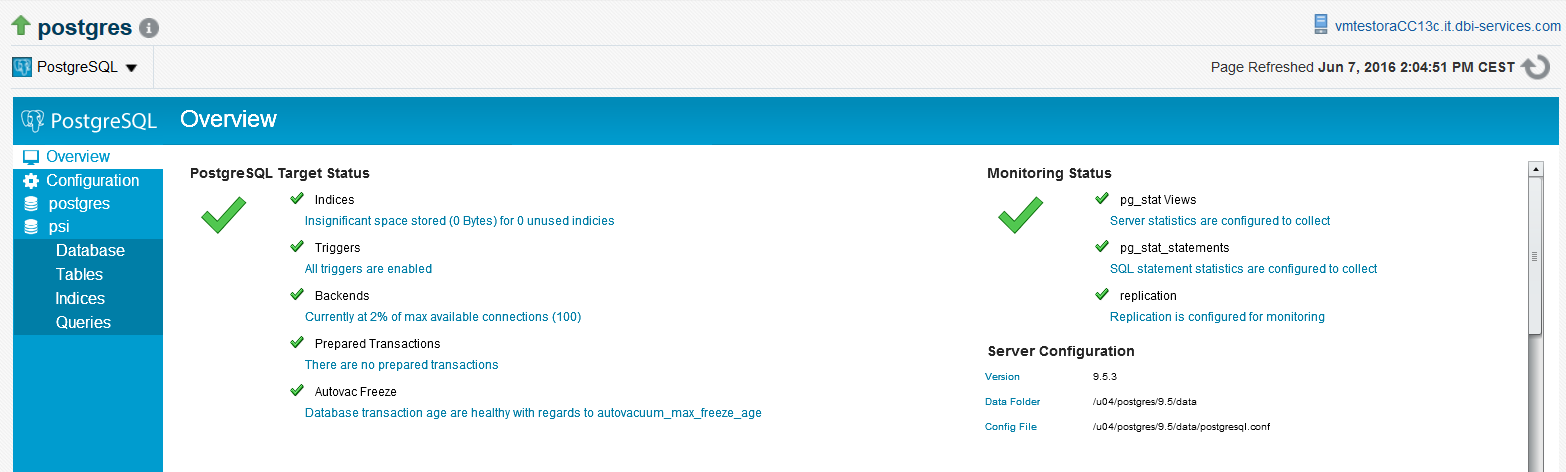
The postgresql monitoring offers a lot of monitoring solutions:
We have the possibility to diplay the table or indices details:

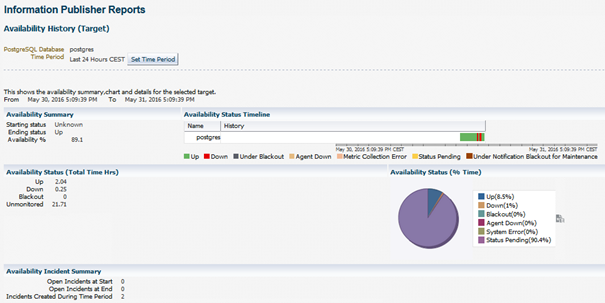
Another good point is the possibility to use the reports. For example the target availability:
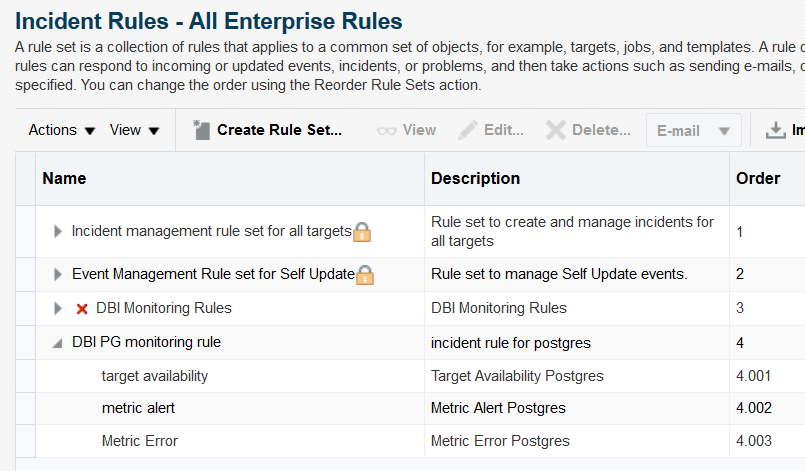
You can also create incident rules in the same way you did it for Oracle databases. Creating incident rules about Availability, Metric Alert or Metric Errors allows you the possibility to have incidents created and to receive alerts when something goes wrong in your posgresql database.
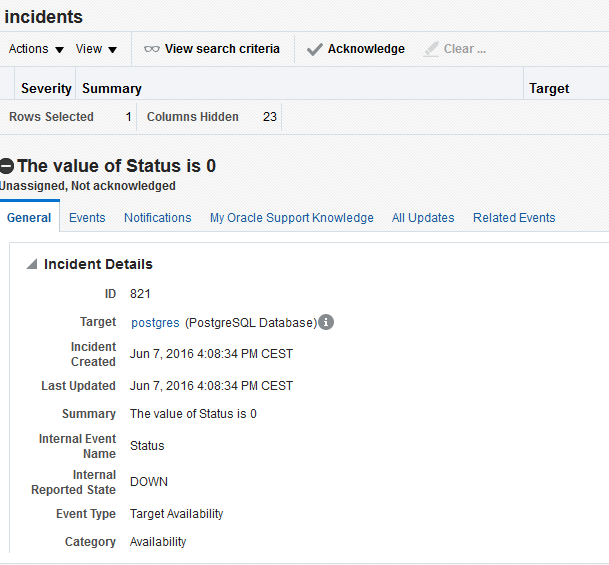
Once you have correctly configured your incident rules and their events, when you stop your postgres database, an incident is created and you receive a mail :=)
Deploying the Blue Medora’s plugin in order to administer your postgresql databases withe Enterprise Manager 13c will help you to administer heteregeneous databases environment. Furthermore you can use monitoring templates and incident rules.
![Thumbnail [60x60]](https://www.dbi-services.com/blog/wp-content/uploads/2022/12/oracle-square.png)
![Thumbnail [90x90]](https://www.dbi-services.com/blog/wp-content/uploads/2022/08/DWE_web-min-scaled.jpg)
Paulo
17.11.2023Hello.
I was looking for this EMCC 13 plugin version developed by Blue Medora. Looks like now it's being developed by Integration Plumbers in a paid license model. Do you guys know if I still can find the Blue Medora version around by any chance?
Thank you in advance.
Paulo.