By Franck Pachot
.
You don’t need good performance only for your system. You need reliable performance. You need performance predictability.
In a previous post I’ve measured physical IO performances of the Oracle Cloud Service, with SLOB. And performance is very good. And I continue to run the following SLOB configuration:
UPDATE_PCT=25
RUN_TIME=3600
WORK_LOOP=100000
SCALE=90000M
WORK_UNIT=64
REDO_STRESS=LITE
LOAD_PARALLEL_DEGREE=4
This is physical I/O (I’ve a small buffer cache here) with a fixed workload (the WORK_LOOP). When you do that, you should follow Kevin’s recommandation to set RUN_TIME to an arbitrary high value so that the run stops only at the end of WORK_LOOP. I thought one hour would always be sufficient but you will see that I was wrong.
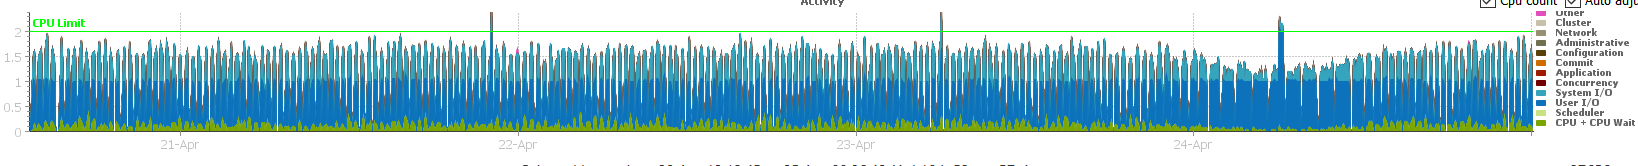
For days, the performance was constant: 15 minutes to do about 6000 physical reads:
Except that we see something different on last Sunday. Let’s zoom at it (I’m using Orachrome Lighty):
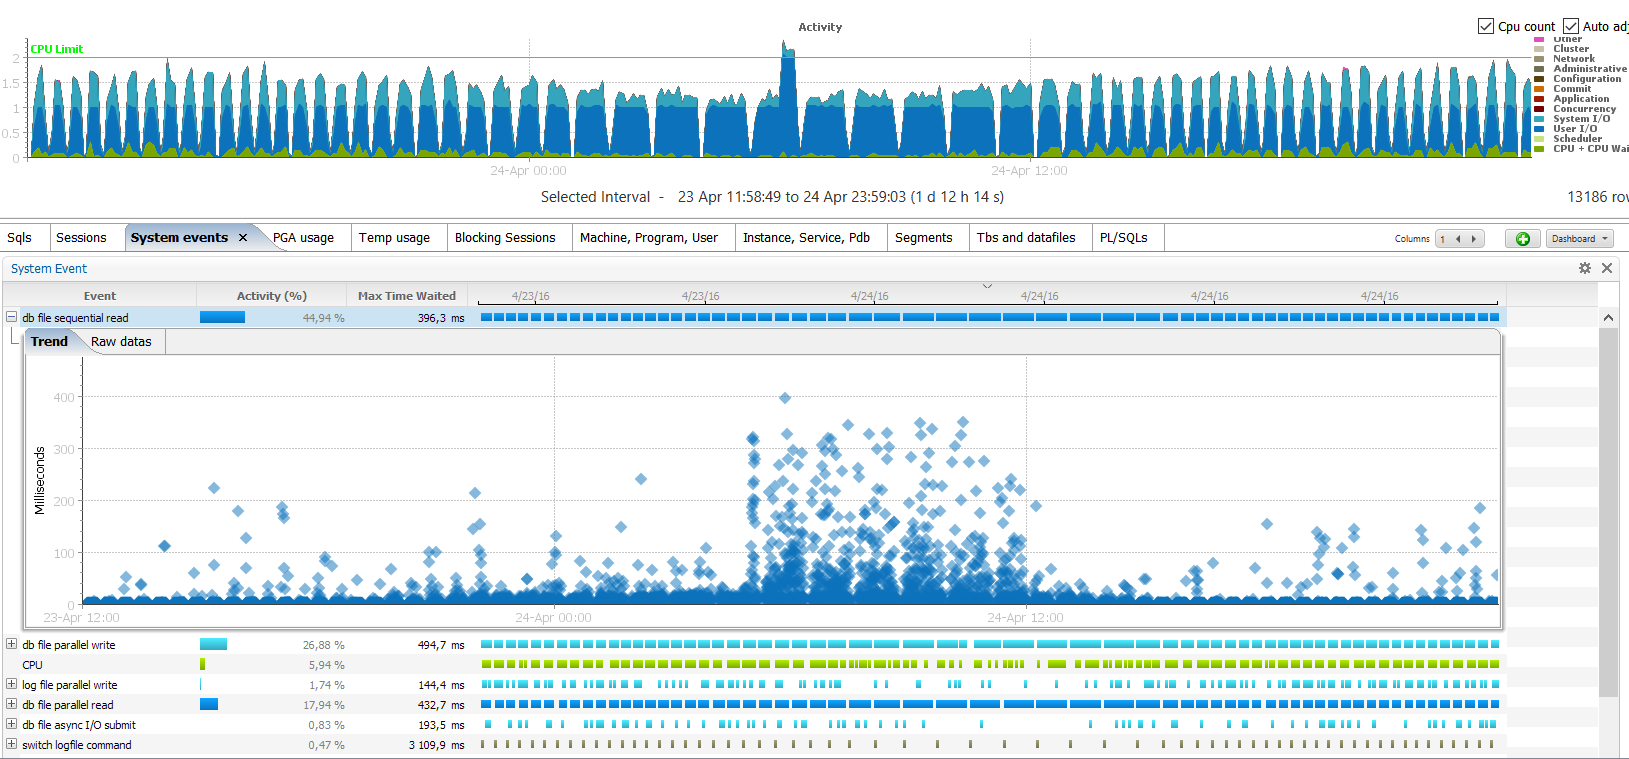
As you see, the run has been longer, starting from April 23rd around 5pm and with the run time increasing. On 24th,from 3am to 10am you don’t see it increasing because it went over the 3600 seconds I’ve set in RUN_TIME. Then it came back to normal after 2pm.
In the lower part, you can see the plots from the Lighty ASH that shows an increase of I/O latency from 5am until noon.
As we don’t see the whole picture because the long run timed out, I extracted the physical reads per second from the AWR shapshots.
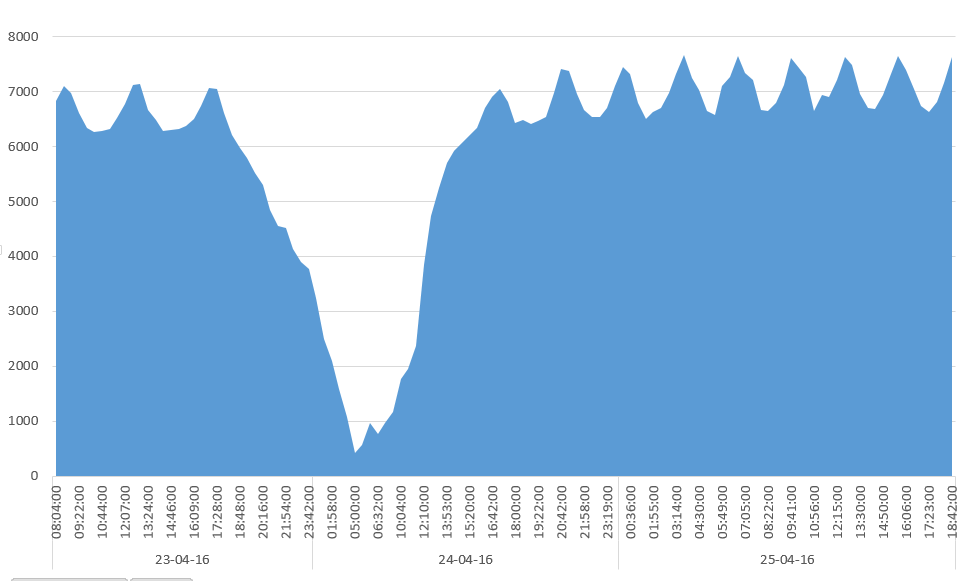
Here are the raw values:
SQL> set pagesize 1000 linesize 1000
column begin_interval_time format a17 trunc
column end_interval_time format a17 trunc
alter session set nls_timestamp_format='dd-mon-yyyy hh24:mi';
select * from (
select begin_interval_time,end_interval_time
,value-lag(value)over(partition by dbid,instance_number,startup_time order by snap_id) physical_reads
,round(((value-lag(value)over(partition by dbid,instance_number,startup_time order by snap_id))
 / (cast(end_interval_time as date)-cast(begin_interval_time as date)))/24/60/60) physical_reads_per_sec
, 24*60*60*((cast(end_interval_time as date)-cast(begin_interval_time as date))) seconds
from dba_hist_sysstat join dba_hist_snapshot using(dbid,instance_number,snap_id)
where stat_name='physical reads'
) where physical_reads>0
/

BEGIN_INTERVAL_TI END_INTERVAL_TIME PHYSICAL_READS PHYSICAL_READS_PER_SEC    SECONDS
----------------- ----------------- -------------- ---------------------- ----------
23-apr-2016 10:17 23-apr-2016 10:34        6385274                   6272       1018
23-apr-2016 10:44 23-apr-2016 11:01        6388349                   6282       1017
23-apr-2016 11:12 23-apr-2016 11:29        6385646                   6316       1011
23-apr-2016 11:39 23-apr-2016 11:56        6386464                   6523        979
23-apr-2016 12:07 23-apr-2016 12:22        6387231                   6780        942
23-apr-2016 12:33 23-apr-2016 12:48        6386537                   7120        897
23-apr-2016 12:59 23-apr-2016 13:14        6389581                   7147        894
23-apr-2016 13:24 23-apr-2016 13:40        6388724                   6669        958
23-apr-2016 13:51 23-apr-2016 14:08        6387493                   6478        986
23-apr-2016 14:18 23-apr-2016 14:35        6386402                   6280       1017
23-apr-2016 14:46 23-apr-2016 15:03        6387153                   6293       1015
23-apr-2016 15:14 23-apr-2016 15:30        6386722                   6317       1011
23-apr-2016 15:41 23-apr-2016 15:58        6386488                   6374       1002
23-apr-2016 16:09 23-apr-2016 16:25        6387662                   6505        982
23-apr-2016 16:36 23-apr-2016 16:51        6387735                   6745        947
23-apr-2016 17:02 23-apr-2016 17:17        6387303                   7066        904
23-apr-2016 17:28 23-apr-2016 17:43        6387304                   7042        907
23-apr-2016 17:54 23-apr-2016 18:10        6388075                   6620        965
23-apr-2016 18:21 23-apr-2016 18:38        6386803                   6219       1027
23-apr-2016 18:48 23-apr-2016 19:06        6387318                   5969       1070
23-apr-2016 19:17 23-apr-2016 19:35        6386298                   5785       1104
23-apr-2016 19:46 23-apr-2016 20:05        6388856                   5517       1158
23-apr-2016 20:16 23-apr-2016 20:36        6387658                   5297       1206
23-apr-2016 20:47 23-apr-2016 21:09        6386522                   4838       1320
23-apr-2016 21:20 23-apr-2016 21:43        6386627                   4555       1402
23-apr-2016 21:54 23-apr-2016 22:17        6387922                   4521       1413
23-apr-2016 22:28 23-apr-2016 22:54        6388141                   4135       1545
23-apr-2016 23:04 23-apr-2016 23:32        6388043                   3905       1636
23-apr-2016 23:42 24-apr-2016 00:11        6392048                   3771       1695
24-apr-2016 00:21 24-apr-2016 00:54        6387294                   3237       1973
24-apr-2016 01:05 24-apr-2016 01:47        6391392                   2506       2550
24-apr-2016 01:58 24-apr-2016 02:49        6389860                   2102       3040
24-apr-2016 03:00 24-apr-2016 04:00        5723619                   1589       3602
24-apr-2016 04:10 24-apr-2016 05:00        3196078                   1073       2980
24-apr-2016 05:00 24-apr-2016 05:10         258522                    416        622
24-apr-2016 05:21 24-apr-2016 06:00        1308239                    564       2321
24-apr-2016 06:00 24-apr-2016 06:21        1246742                    973       1281
24-apr-2016 06:32 24-apr-2016 07:32        2743521                    762       3602
24-apr-2016 07:43 24-apr-2016 08:43        3498613                    971       3602
24-apr-2016 08:53 24-apr-2016 09:53        4207757                   1168       3603
24-apr-2016 10:04 24-apr-2016 11:00        5884053                   1764       3335
24-apr-2016 11:00 24-apr-2016 11:04         507668                   1960        259
24-apr-2016 11:15 24-apr-2016 12:00        6392338                   2371       2696
24-apr-2016 12:10 24-apr-2016 12:38        6387428                   3841       1663
24-apr-2016 12:49 24-apr-2016 13:11        6392759                   4742       1348
24-apr-2016 13:22 24-apr-2016 13:42        6387570                   5244       1218
24-apr-2016 13:53 24-apr-2016 14:12        6397352                   5707       1121
24-apr-2016 14:23 24-apr-2016 14:41        6389321                   5916       1080
24-apr-2016 14:51 24-apr-2016 15:09        6391483                   6070       1053
24-apr-2016 15:20 24-apr-2016 15:37        6385094                   6205       1029
24-apr-2016 15:47 24-apr-2016 16:04        6386833                   6342       1007
However, don’t think that performance was bad then. You have disks and average single block read in in few milliseconds:
Top 10 Foreground Events by Total Wait Time
~~~~~~~~~~~~~~~~~~~~~~~~~~~~~~~~~~~~~~~~~~~
                                           Total Wait       Wait   % DB Wait
Event                                Waits Time (sec)    Avg(ms)   time Class
------------------------------ ----------- ---------- ---------- ------ --------
db file sequential read             74,045      446.5       6.03   71.7 User I/O
db file parallel read                3,010      170.2      56.55   27.3 User I/O
DB CPU                                           10.6               1.7
log file sync                            3          0       0.79     .0 Commit
Disk file operations I/O                 5          0       0.14     .0 User I/O
utl_file I/O                             4          0       0.02     .0 User I/O
SQL*Net message to client                6          0       0.00     .0 Network
db file async I/O submit                 0          0                .0 System I
reliable message                         0          0                .0 Other
db file single write                     0          0                .0 User I/O
And the wait event histograms shows that only few I/O calls were above 32 milliseconds at the time of the worst IOPS:
                                                 % of Total Waits
                                 -----------------------------------------------
                           Waits
                           64ms
Event                      to 2s <32ms <64ms <1/8s <1/4s <1/2s   <1s   =2s
------------------------- ------ ----- ----- ----- ----- ----- ----- ----- -----
Data file init write          12  20.0  20.0  40.0  20.0
Disk file operations I/O       5  93.6   5.1                     1.3
control file sequential r      1 100.0                .0
db file async I/O submit      27  96.7    .9   1.1    .7    .4    .1    .1
db file parallel read       1487  50.6  24.0  13.8   8.3   3.4
db file parallel write       853  74.8  10.0   8.4   5.9    .9    .0
db file sequential read     2661  96.5   1.6   1.1    .6    .2    .0
Here is the wait event histogram at microsecond level at the time where the storage head cache hit was probably at its minimum.
06:21:48 SQL>
EVENT                          WAIT_TIME_MICRO WAIT_COUNT WAIT_TIME_FORMAT
------------------------------ --------------- ---------- ------------------------------
db file sequential read                      1          0 1 microsecond
db file sequential read                      2          0 2 microseconds
db file sequential read                      4          0 4 microseconds
db file sequential read                      8          0 8 microseconds
db file sequential read                     16          0 16 microseconds
db file sequential read                     32          0 32 microseconds
db file sequential read                     64          0 64 microseconds
db file sequential read                    128          0 128 microseconds
db file sequential read                    256      16587 256 microseconds
db file sequential read                    512     340140 512 microseconds
db file sequential read                   1024      56516 1 millisecond
db file sequential read                   2048       5140 2 milliseconds
db file sequential read                   4096      12525 4 milliseconds
db file sequential read                   8192      45465 8 milliseconds
db file sequential read                  16384      53552 16 milliseconds
db file sequential read                  32768      14962 32 milliseconds
db file sequential read                  65536       9603 65 milliseconds
db file sequential read                 131072       4430 131 milliseconds
db file sequential read                 262144       1198 262 milliseconds
db file sequential read                 524288        253 524 milliseconds
db file sequential read                1048576          3 1 second
Those are the performances that you can expect from a busy load when you don’t hit the storage head cache. It’s not bad on average. This is just what you can expect from disk.
You just need to keep in mind that the amazing performances that you can see usually are not guaranteed. It’s very nice to get those performance for development or test environments, but do not rely on it.
![Thumbnail [60x60]](https://www.dbi-services.com/blog/wp-content/uploads/2022/12/oracle-square.png)
![Thumbnail [90x90]](https://www.dbi-services.com/blog/wp-content/uploads/2022/08/DWE_web-min-scaled.jpg)