By Franck Pachot
.
Linux kernel has a powerful instrumentation that can be accessed easily. When you want to drill down into your program functions to understand their CPU usage, “perf” is the easiest. It can attach to the processes, sample the CPU cycles, get the symbol name, or even the call stack. And display an histogram of sample counts. This provides an easy profiling tool to understand in which function your program spends its CPU time, so that you know where an improvement can optimize the overall resource usage. But I’m seeing that people may be intimidated by this kind of tools and doesn’t know how to interpret the percentages.
The best way to confirm your understanding is running a small example where you know the behavior, and look at which numbers the tool provides.
f1(int n) {
  int i; for (i = 0; i <= 5; i++) {}; return i;
};
f2(int n) {
  int i; for (i = 0; i <= 5; i++) {}; return i;
};
main() {
  int r;
  int i; for (i = 0;; i++) {
    (i % 3 == 0) ? f1(i): f2(i);
  };
  return r;
}
I have two functions f1() and f2() which do exactly the same thing. I just want to have different names. And the main() function loops and calls the f1() function 1/3rd of times and f2() 2/3rd of times, thanks to the (i % 3) condition on modulo 3
perf top -F100 -d10 -p$(pgrep -d, a.out)
You can simply run `perf top` but here I explicitly reduced the sample frequency to 100Hz (safer to reduce the overhead of sampling) and the display refresh frequency to 10 seconds because it is simple to take consistent screenshots. I measure only my program by getting the PID through `pgrep -d, a.out`. I display only the userspace symbols by hiding the kernel ones (-K). There are many possibilities to target specific processes in `perf` as well in `pgrep`but that’s not the goal of this post. The man pages are clear about that.
Samples: 4K of event 'cycles', 100 Hz, Event count (approx.): 69818773752 lost: 0/0 drop: 0/0
Overhead  Share  Symbol
  59.86%  a.out  [.] f2
  31.10%  a.out  [.] f1
   9.04%  a.out  [.] main
The “Shared Object” is my program (a.out) or a library that is called, or the kernel. Here I didn’t specify the process. Symbols are the C functions. And the “Overhead” percentage sums to 100% and this is where it is important to filter what you sample so that it is easy to profile it as a ratio of the total samples for this target.
This is the default option, showing the symbols but not the call stack, the percentages are the time spend in the function. My program spends only 9.04% of its CPU time in main() because very few is done there. When main() calls a function, the samples are accounted for the function but not for main(). On the remaining time (91%) one third of the time is spent in f1() and two third in f2().
This may already be sufficient to know where to investigate for optimizing the code. For example, if you divide by two the work done in f2() you know that this will reduce by 30% the CPU usage for your program (the math is: 50% x 59.86%)
call-graph
Reducing the resources used by a function is one possibility. But the best optimization would be to avoid calling it too often. And I have no information to help me about that. Nothing here tells me that f1() is called from main(). It could have been called from f2(). Or from both. When troubleshooting a program execution, knowing the function is not enough, we need to see the whole call stack.
perf top -F100 -d10 -p$(pgrep a.out) -K -g
I’ve added -g here to record the call stack (not only in which function we are when sampling, but also where the functions come from). There are different modes that you can choose with –call-graph but I’m using the default here.
Samples: 3K of event 'cycles', 100 Hz, Event count (approx.): 37649486188 lost: 0/0 drop: 0/0
  Children      Self  Shared Objec  Symbol
+   95.61%     8.19%  a.out         [.] main
+   60.64%    60.64%  a.out         [.] f2
+   31.17%    31.17%  a.out         [.] f1
+   15.55%     0.00%  libc-2.17.so  [.] __libc_start_main
Here the “Self” column is similar to what I had without “-g”: this is the percentage of CPU cycles spent in each function. But the “Children” column adds the time spent in all called functions below it. Not only the immediate children, but all descendants. For leaves of the call graph, functions not calling anything else, the value of Self and Children is equal. But for main() it adds the time spent in f1()<-main() and f2()<-main(). You read the first line as: 95.61% of time is spent in the call to main() and only 8.19% is on main() instructions because it calls other functions most of the time. Note that you cad add “Self” to cover 100% but in “Children” the children samples are accounted in many lines. The idea is to see on top the fragment of call stack that accounts for the most samples.
There’s a “+” where you can drill down. I do it for all of them here be you typically go to the one you want to analyze deeper:
-   95.61%     8.19%  a.out         [.] main
   - 87.42% main
        57.68% f2
        29.74% f1
   - 8.19% __libc_start_main
        main
-   60.64%    60.64%  a.out         [.] f2
   - 60.64% __libc_start_main
      - 57.68% main
           f2
        2.97% f2
-   31.17%    31.17%  a.out         [.] f1
   - 31.17% __libc_start_main
      - 29.74% main
           f1
        1.42% f1
-   15.55%     0.00%  libc-2.17.so  [.] __libc_start_main
   - __libc_start_main
      - 14.63% main
           8.96% f2
           4.58% f1
When drilling-down the first line I can see that the difference between 95.61% in main() call and 8.19% in main() instructions is in calls to f2() and f1(). Note that you understand the reason why I’ve set –delay to 10 seconds: to be able to drill down on the same numbers before refresh in order to make this clearer in the blog post. Because with 100Hz sampling the numbers may change slightly.
callee/caller
In order to investigate on functions that are called from many places, I replace the work done in f2() by a call to f1():
f1(int n) {
  int i; for (i = 0; i <= 5; i++) {}; return i;
};
f2(int n) {
  return f1(n);
};
main() {
  int r;
  int i; for (i = 0;; i++) {
    (i % 3 == 0) ? f1(i): f2(i);
  };
  return r;
}
Now, in addition to being called 1/3 of time from main, most of the time spent in f2() is also calling f1().
Samples: 255  of event 'cycles', 100 Hz, Event count (approx.): 5934954123 lost: 0/0 drop: 0/0
Overhead  Share  Symbol
  83.59%  a.out  [.] f1
  12.81%  a.out  [.] main
   3.60%  a.out  [.] f2
Without the call graph, the time spend in the function instructions is, proportionally to the total time, now mostly in f1() because f1() is called in all by branch condition. The part accounted in f2() is minimal.
perf record -F100 -g --delay=5 -v -p $(pgrep -d, a.out) -a sleep 30
perf report | cat
Rather than looking at it live, I record the samples (mentioning the PID but running a `sleep 30` to record for 30 seconds).
Samples: 764  of event 'cycles', Event count (approx.): 18048581591
  Children      Self  Command  Shared Object      Symbol
+  100.00%     0.00%  a.out    libc-2.17.so       [.] __libc_start_main
+   99.47%    10.87%  a.out    a.out              [.] main
-   86.22%    85.68%  a.out    a.out              [.] f1
   - 85.68% __libc_start_main
      - main
         - 57.78% f2
              f1
           27.90% f1
   - 0.54% f1
      + 0.54% apic_timer_interrupt
-   60.82%     2.77%  a.out    a.out              [.] f2
   - 58.05% f2
        f1
   - 2.77% __libc_start_main
      - 2.24% main
           f2
        0.53% f2
+    0.68%     0.00%  a.out    [kernel.kallsyms]  [k] apic_timer_interrupt
+    0.68%     0.00%  a.out    [kernel.kallsyms]  [k] smp_apic_timer_interrupt
If we look at the f1() detail we can see 27.90% with f1()<-main() which is the 1/3rd calls from there. And 57.78% with f1()<-f2()<-main() for the 2/3rd of the conditional branch. With of course some time in main() itself (10.87%) and in f2() itself (2.77%)
This is the caller breakdown which can also be displayed with `perf report –call-graph ,,,,caller`
We see that f1() is on CPU 57.78% of time through f1()<-f2()<-main() and 27.90% directly through f2()<-main()
We can also display it with breakdown on callee: by changing the call graph order as `perf report –call-graph ,,,,callee`
Samples: 764  of event 'cycles', Event count (approx.): 18048581591
  Children      Self  Command  Shared Object      Symbol
-  100.00%     0.00%  a.out    libc-2.17.so       [.] __libc_start_main
     __libc_start_main
-   99.47%    10.87%  a.out    a.out              [.] main
     main
     __libc_start_main
-   86.22%    85.68%  a.out    a.out              [.] f1
   - f1
      - 58.05% f2
           main
           __libc_start_main
      - 28.17% main
           __libc_start_main
-   60.82%     2.77%  a.out    a.out              [.] f2
   - f2
      - 60.29% main
           __libc_start_main
        0.53% __libc_start_main
+    0.68%     0.00%  a.out    [kernel.kallsyms]  [k] apic_timer_interrupt
+    0.68%     0.00%  a.out    [kernel.kallsyms]  [k] smp_apic_timer_interrupt
This shows that among the 86.22% samples in f1() 58.05% are from f2() and 28.17% from main
folded
With long call stack, it may be easier to read them folded (and this is what is used by Brendan Gregg Flame Graphs ):
perf report --call-graph ,,,,caller -g folded --stdio

# Children      Self  Command  Shared Object      Symbol
# ........  ........  .......  .................  ..............................................
#
   100.00%     0.00%  a.out    libc-2.17.so       [.] __libc_start_main
57.78% __libc_start_main;main;f2;f1
27.90% __libc_start_main;main;f1
10.87% __libc_start_main;main
2.24% __libc_start_main;main;f2
0.53% __libc_start_main;f2
    99.47%    10.87%  a.out    a.out              [.] main
57.78% main;f2;f1
27.90% main;f1
10.87% __libc_start_main;main
2.24% main;f2
    86.22%    85.68%  a.out    a.out              [.] f1
57.78% __libc_start_main;main;f2;f1
27.90% __libc_start_main;main;f1
    60.82%     2.77%  a.out    a.out              [.] f2
57.78% f2;f1
2.24% __libc_start_main;main;f2
0.53% __libc_start_main;f2
Here are the number of sample in each call stack. For example, just looking at the top I can see that 57.78% is on main()->f2->f1(). So if I can optimize something there in the number of calls from f2() to f1(), I know that I can address a large part of the response time, and CPU resource. This even without optimizing f1() itself. Remember that there are two ways to improve the performance: do it faster and do it less.
perf report --call-graph ,,,,callee -g folded --stdio

# Children      Self  Command  Shared Object      Symbol
# ........  ........  .......  .................  ..............................................
#
   100.00%     0.00%  a.out    libc-2.17.so       [.] __libc_start_main
100.00% __libc_start_main
    99.47%    10.87%  a.out    a.out              [.] main
99.47% main;__libc_start_main
    86.22%    85.68%  a.out    a.out              [.] f1
58.05% f1;f2;main;__libc_start_main
28.17% f1;main;__libc_start_main
    60.82%     2.77%  a.out    a.out              [.] f2
60.29% f2;main;__libc_start_main
0.53% f2;__libc_start_main
     0.68%     0.00%  a.out    [kernel.kallsyms]  [k] apic_timer_interrupt
     0.68%     0.00%  a.out    [kernel.kallsyms]  [k] smp_apic_timer_interrupt
When folding in the callee order, the focus is on the function itself. Here I can quickly see that f1() is the hotspot, through f1()<-f2()<-main() and f1()<-main() call chains.
filter
Between caller and callee, when you have a very large call stack, with functions called from many places, and and others calling many functions, it may be difficult to zoom on the point where you want to investigate. I do it in two steps in this case. First, a simple `sudo perf top` to see the functions which is on the top of CPU usage:
   PerfTop:     435 irqs/sec  kernel: 6.0%  exact:  0.0% lost: 0/0 drop: 0/617 [1000Hz cycles],  (all, 2 CPUs)
---------------------------------------------------------------------------------------------------------------------------------------------

    15.41%  libsnappy.so.1.3.0                      [.] snappy::RawUncompress
     4.75%  librocksdb.so                           [.] rocksdb::(anonymous namespace)::BytewiseComparatorImpl::Compare
     4.19%  librocksdb.so                           [.] rocksdb::BlockIter::BinarySeek
     2.32%  librocksdb.so                           [.] rocksdb::MemTable::KeyComparator::operator()
     2.14%  librocksdb.so                           [.] rocksdb::BlockIter::ParseNextKey
     2.12%  librocksdb.so                           [.] rocksdb::InternalKeyComparator::Compare
This is the “Self” value: 15% of the samples system-wide are in the snappy::RawUncompress C++ method from the libsnappy.so.1.3.0
sudo perf record -F99 -g --call-graph fp --delay=5 -v -p $(pgrep -d, yb-tserver) -a sleep 10
sudo perf report --call-graph ,,,,callee --symbol-filter=RawUncompress
Here I record more precisely the processes I’m analyzing and filter the report on “RawUncompress”
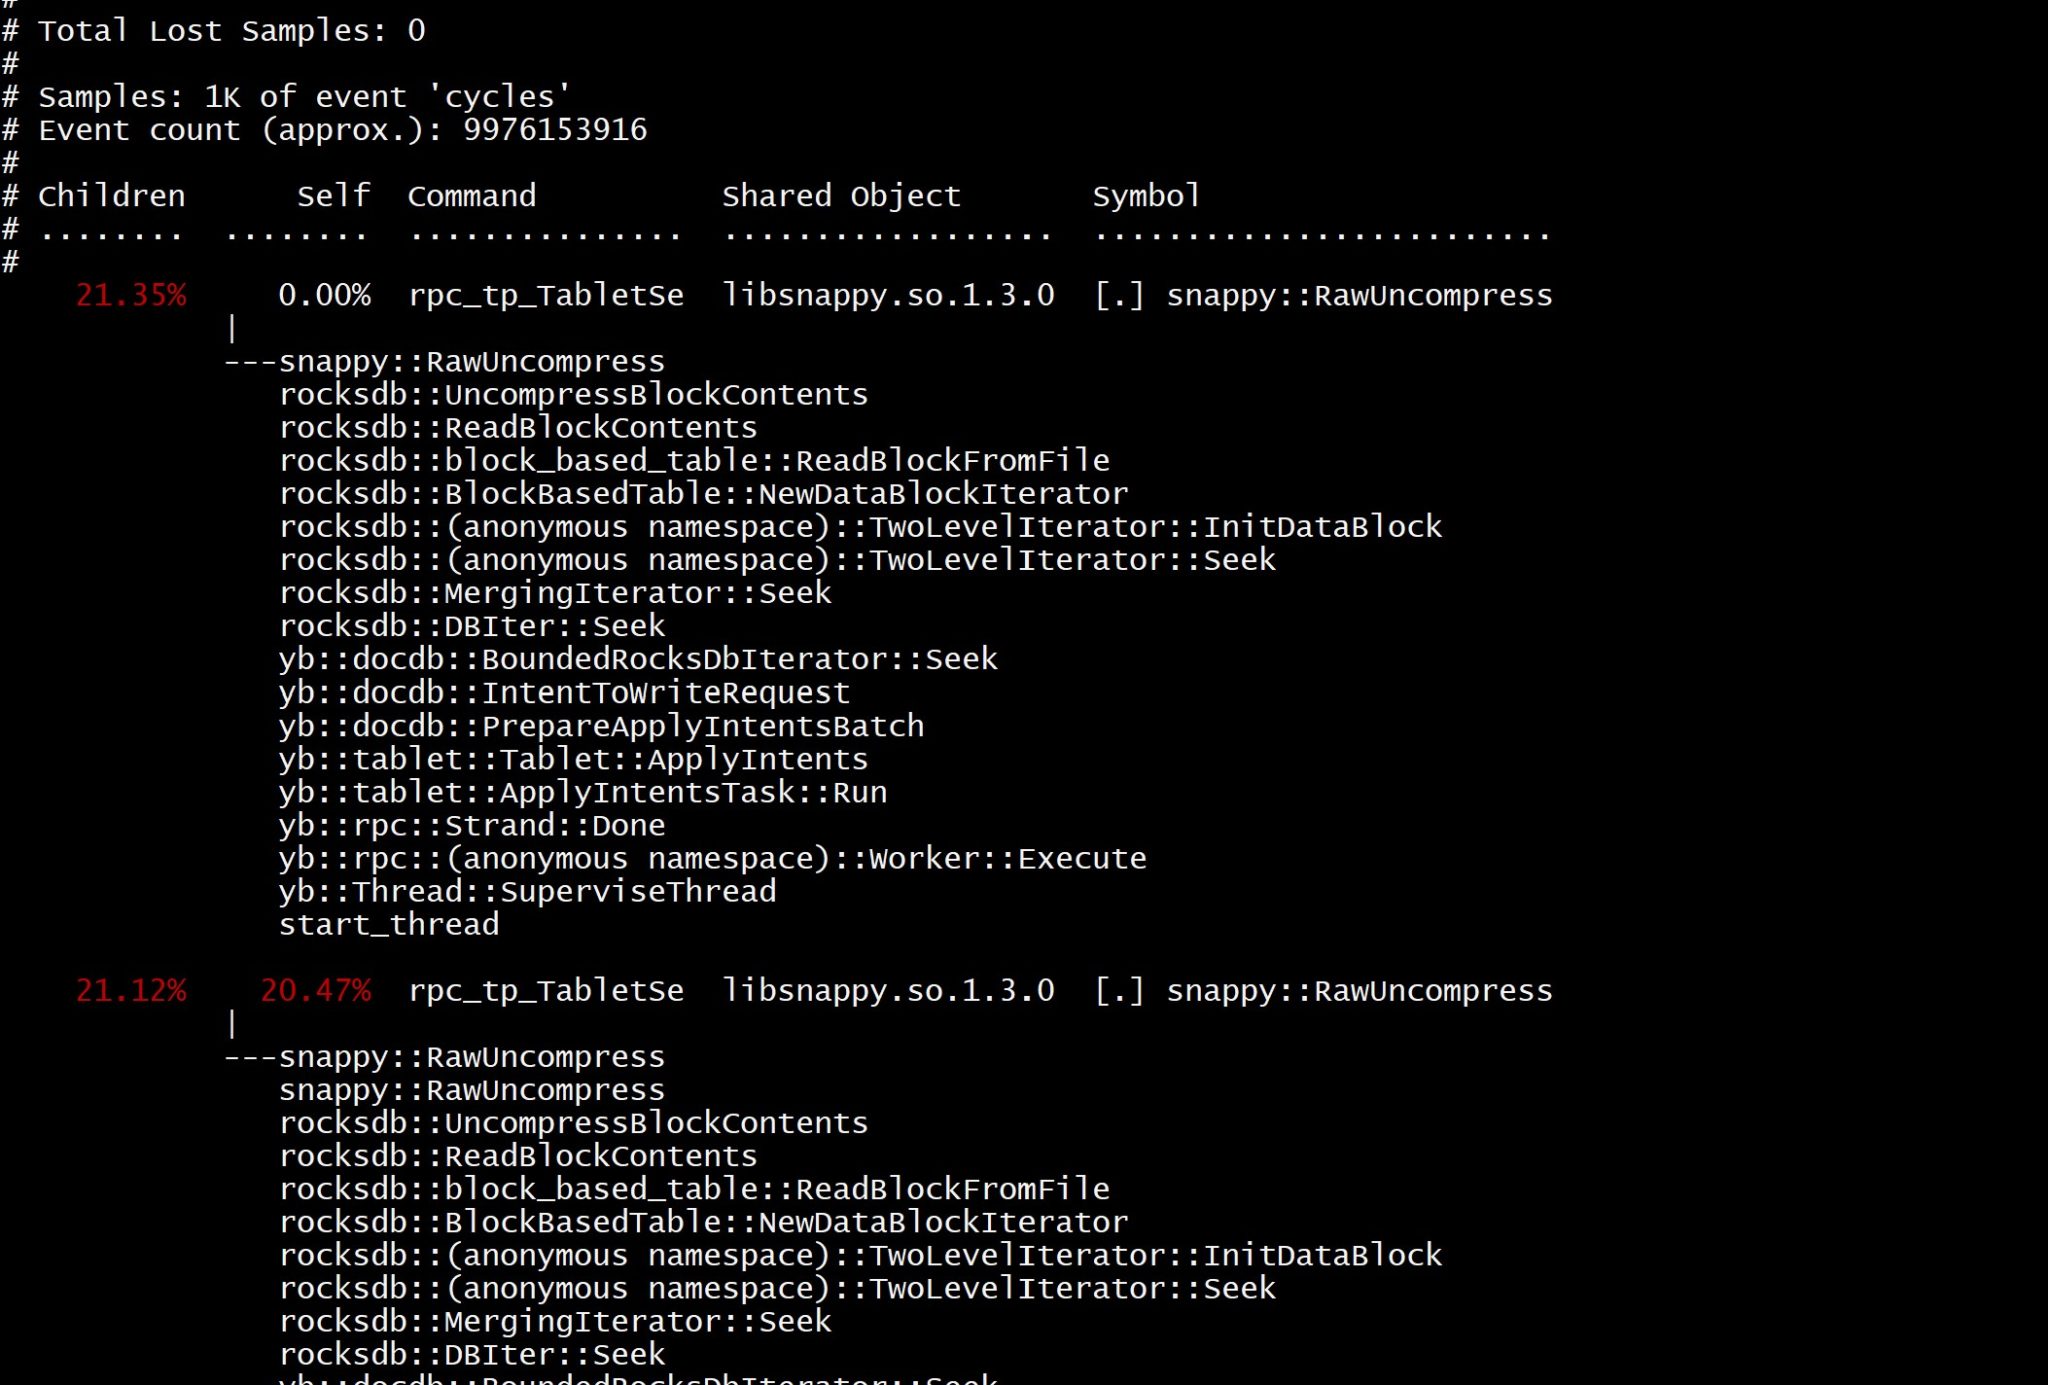
Here I have the full call stack from the start of the thread down to this snappy::RawUncompress callee function, knowing that this code path accounts for 21.35% of the processes I recorded. This is an example of quick profiling. It will not solve your issue, but will help you to know where you have to look at to reduce the CPU usage. In performance troubleshooting, when you feel like trying to find the needle in the haystack, you should start by finding the haystack and that’s where you need profiling. The event sampling approach is less intrusive than attaching a debugger. And samples are often sufficient to find the hotspot.
![Thumbnail [60x60]](https://www.dbi-services.com/blog/wp-content/uploads/2022/05/open-source-author.png)
![Thumbnail [90x90]](https://www.dbi-services.com/blog/wp-content/uploads/2022/08/ENB_web-min-scaled.jpg)
![Thumbnail [90x90]](https://www.dbi-services.com/blog/wp-content/uploads/2022/08/ADE_WEB-min-scaled.jpg)
![Thumbnail [90x90]](https://www.dbi-services.com/blog/wp-content/uploads/2022/08/MOP_web-min-scaled.jpg)
amnuser
22.07.2023One of the best technical top-based summaries I've ever seen. Thank you.