By Franck Pachot
.
In the previous post we have seen how In-Memory Compression Unit map to the physical persistent storage – table extents. Let’s see now how they are mapped to column values, allowing to optimize the scan in a similar way as Exadata Storage Indexes.
The examples below will illustrate IMCU pruning and IMCU skip filtering. Here are the slides I use for another example:
 |
 |
V$IM_SMU_HEAD
Here are the 4 IMCUs I have from the previous post.
SQL> select objd,tsn,startdba,extent_cnt,block_cnt,load_scn,itl_cnt,total_rows,invalid_rows from V$IM_SMU_HEAD;

      OBJD        TSN   STARTDBA EXTENT_CNT  BLOCK_CNT LOAD_SCN            ITL_CNT TOTAL_ROWS INVALID_ROWS
---------- ---------- ---------- ---------- ---------- ---------------- ---------- ---------- ------------
    107958          6    1572875         22          5 941292582               255     491079            0
    107958          6    1573890          8        126 941292582               255     561354            0
    107958          6    1574914          8        126 941292582               255     524160            0
    107958          6    1575938          7        126 941292582               255     423407            0
The important values to remember are the number of rows in each IMCUs.
In total I have 2 million rows.
V$IM_COL_CU
The table was created with:
create table DEMO inmemory tablespace USERS as select rownum num,mod(rownum,10) ten from xmltable('1 to 2000000');
I have two columns in my table:
- NUM: is a number from 1 to 2 millions
- TEN: have values from 0 to 9, equally distributed on all the table
Each IMCU stores the minimum and maximum value for each column in each IMCU and we can see them from V$IM_COL_CU.
The min and max are stored in row format in the same way as in the column statistics. When we know the datatype, we can use the dbms_stats.convert_raw_value to display them. It’s a procedure, not a function, and in 12c I like to create an inline function to use it easily:
SQL> break on head_piece_address skip 1 duplicates
SQL> with function row2num(x raw) return number as n number; begin dbms_stats.convert_raw_value(x,n); return n; end;
  2  select head_piece_address,column_number,length/1024/1024,dictionary_entries,row2num(minimum_value),row2num(maximum_value) from V$IM_COL_CU order by 1,2,3,4
  3  /

HEAD_PIECE_ADDRE COLUMN_NUMBER LENGTH/1024/1024 DICTIONARY_ENTRIES ROW2NUM(MINIMUM_VALUE) ROW2NUM(MAXIMUM_VALUE)
---------------- ------------- ---------------- ------------------ ---------------------- ----------------------

0000000067FFFDD8             1       4.84460545             491079                      1                 491079
0000000067FFFDD8             2       .234272003                 10                      0                      9

00000000686FFDD8             1       5.66581059             561354                 491080                1052433
00000000686FFDD8             2       .267781258                 10                      0                      9

00000000626FFDA8             1        5.6811142             524160                1052434                1576593
00000000626FFDA8             2       .250045776                 10                      0                      9

00000000620FFDA8             1        4.5891037             423407                1576594                2000000
00000000620FFDA8             2       .202003479                 10                      0                      9
For the first column NUM:
- 1st IMCU: 491079 values from 1 to 491079
- 2nd IMCU: 561354 values from 491080 to 1052433
- 3rd IMCU: 524160 values from 1052434 to 1576593
- 4th IMCU: 423407 values from 1576594 to 2000000
And the second column TEN:
- 1st IMCU: 10 distinct values from 0 to 9
- 2nd IMCU: 10 distinct values from 0 to 9
- 3rd IMCU: 10 distinct values from 0 to 9
- 4th IMCU: 10 distinct values from 0 to 9
IM Full Scan
First, I check the IM statistics for my session:
SQL> select name,value from v$mystat join v$statname using(statistic#) where ( name like 'IM%row%' or name like 'IM%block%' ) and value>0;

NAME                       VALUE
---------------------- ---------
IM scan rows             2000000
IM scan rows valid       2000000
IM scan rows projected   2000000
This what I’ve read previously when populating the IMCS: 2 million rows.
The following will be done in the same session, so statistics cumulates, but I’ll add the delta values in front.
Now I’m running a query that has to scan all rows
SQL> select distinct ten from DEMO ;

...
10 rows selected.
I’ve read all 2 million rows and have find 10 distinct values from the TEN column.
Now checking my session statistics again:
SQL> select name,value from v$mystat join v$statname using(statistic#) where ( name like 'IM%row%' or name like 'IM%block%' ) and value>0;

NAME                        VALUE
---------------------- ----------
IM scan rows              4000000     +2000000
IM scan rows valid        4000000     +2000000
IM scan rows projected    2000040          +40
Among the 2 million rows I had to actually read the 2 million rows because I’ve no filter here.
The result of the projection is 10 rows (my ‘distinct’ results) but the projection has been made for each IMCU and this is why we see 40 here.
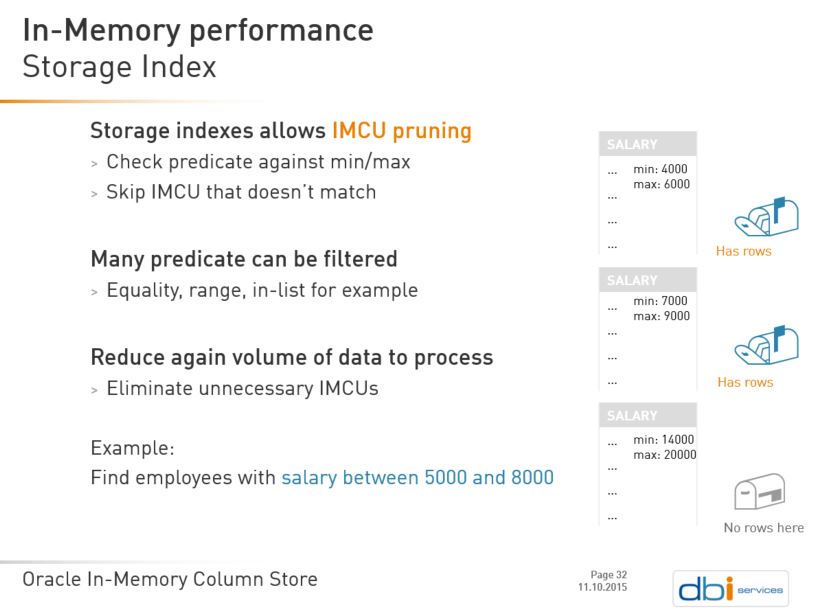
IMCU Pruning
Let’s run a query that filters only 100000 rows that are within the second IMCU – the one having values from 491080 to 1052433 for column 1 (see above).
SQL> select distinct ten from DEMO where num between 500000 and 600000;

...
10 rows selected.
I get different figures now:
SQL> select name,value from v$mystat join v$statname using(statistic#) where ( name like 'IM%row%' or name like 'IM%block%' ) and value>0;

NAME                        VALUE
---------------------- ----------
IM scan rows              6000000     +2000000
IM scan rows valid        4561354      +561354
IM scan rows optimized    1438646     +1438646
IM scan rows projected    2000050          +10
IM scan CUs pruned              3           +3
IM scan segments minmax         4           +4
The 2 millions rows are split among ‘valid’ and ‘optimized’. Thanks to the minimum and maximum values stored for each IMCU, pruning has occurred. Only the second IMCU has been scanned and filtered because it’s the only one that can contain values from 500000 to 600000.
It contains 561354 rows and this is what is counted as ‘valid’ rows where filtering has to be done. Pruning has saved the processing of the 1438646 rows that are in the other IMCU because we are sure they do not verify the predicate.
If you look at the projected rows, there are only 10 because it’s the number of distinct values coming from the only one IMCU processed.
The ‘minmax’ optimization has been used on the 4 IMCUs and 3 of them have been ‘pruned’. This is the ‘no mail’ flag on the mailbox icon in my slides: you know that there is no mail without having to open the mail box.
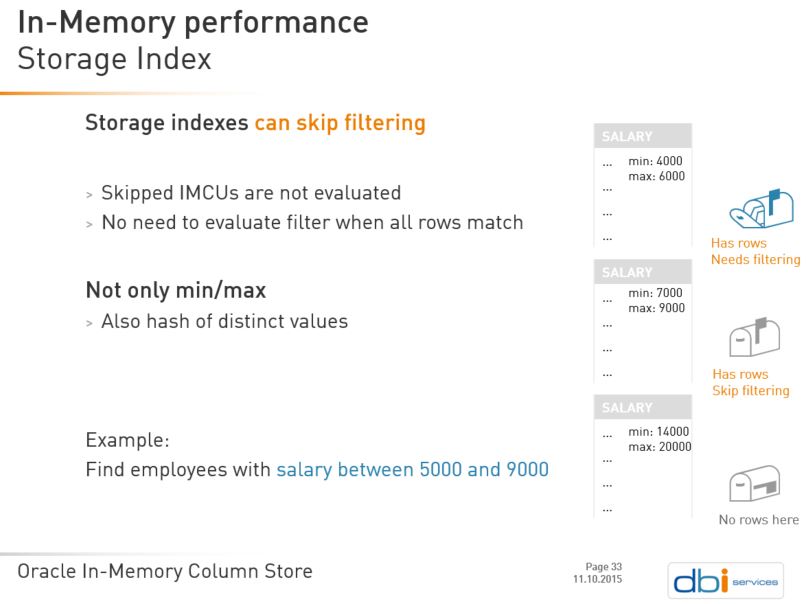
IMCU Skipping
Now running the query with a larger range that spans three IMCUs.
SQL> select distinct ten from DEMO where num between 500000 and 2000000;

...
10 rows selected.
From what we have seen above, only the 1st IMCUs can be pruned now:
SQL> select name,value from v$mystat join v$statname using(statistic#) where ( name like 'IM%row%' or name like 'IM%block%' ) and value>0;

NAME                        VALUE
---------------------- ----------
IM scan rows              8000000     +2000000
IM scan rows valid        6070275     +1508921
IM scan rows optimized    1929725      +491079
IM scan rows projected    2000080          +30
IM scan CUs optimized read      2           +2
IM scan CUs pruned              4           +1
IM scan segments minmax         8           +4
We have scanned 3 IMCU here, totalizing 561354+524160+423407=1508921 rows and we saved the scan of the 1st IMCU (491079 rows). We did projection on the 3 IMCUs which return 10 rows each. The 4 IMCUs have been considered for ‘minmax’ and only one has been pruned.
But there is more here. ‘IM scan CUs optimized read’ appeared here. The filter scan is done to get the vector of rows that match the predicate. But from min/max we know that the 3rd and 4th IMCUs have all rows matching because both their min and max are between 500000 and 2000000. This is filter skipping, accounted with ‘IM scan CUs optimized read’
Dictionary entries
If you look above at the V$IM_COL_CU view we have not only the minimum and maximum value. We have the number of dictionary entries which looks like the number of distinct values. Why is it called like that? Because the distinct values are stored in a dictionary. A guess is that it can be used for dictionary encryption (each value is replaced by a number which is the position of that data item in a dictionary).
But for sure, if that dictionary covers all possible values, then some equality filtering can be done from there. Let’s look if we can do IMCU pruning for a query that select no rows:
SQL> select distinct ten from DEMO where where ten=10;

...
no rows selected.
SQL> select name,value from v$mystat join v$statname using(statistic#) where ( name like 'IM%row%' or name like 'IM%block%' ) and value>0;
NAME VALUE
---------------------- ----------
IM scan rows 10000000 +2000000
IM scan rows valid 8070275 +2000000
IM scan rows optimized 1929725
IM scan rows projected 2000080
IM scan CUs pruned 8 +4
IM scan segments minmax 12 +4
The 4 IMCUs were candidate for ‘minmax’ but no pruning occured. From those statistics, it seems that the dictionary entries are not used for pruning.
![Thumbnail [60x60]](https://www.dbi-services.com/blog/wp-content/uploads/2022/12/oracle-square.png)
![Thumbnail [90x90]](https://www.dbi-services.com/blog/wp-content/uploads/2022/08/DWE_web-min-scaled.jpg)
![Thumbnail [90x90]](https://www.dbi-services.com/blog/wp-content/uploads/2022/08/JDU_web-min-scaled.jpg)