
This article is the second on a series of 3 about customer issues in Oracle 11g. The goal is to show how the new version of Oracle solves these issues. This blog will focus on a common issue, when Oracle is not able to get a good histogram because some data is missing at the time the job gathers the statistics
These 3 real customer cases have been presented during my session “Solving critical customer issues with the Oracle 12c Optimizer” at the Oracle Open World 2013
Context
The application is a very well known DMS (Document Management System). It’s used to store documents inside the database or on external storage.
In that application, a table DOC_ATTRIBUTES is responsible for keeping all attributes of all documents including a category. At customer site, there are many categories to identify the documents. There are few categories with a very few number of rows compared to the main categories.
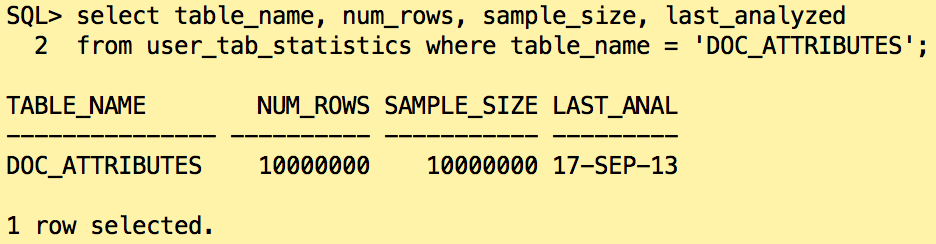
A statement is regularly started to look for document in a category with a few records, let’s have a look on the table:
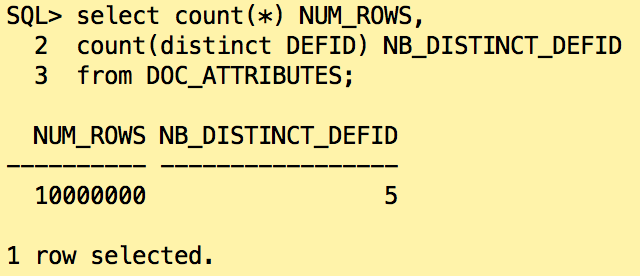
For that demo, I’ve reproduced 5 distinct categories for 10 millions of rows.
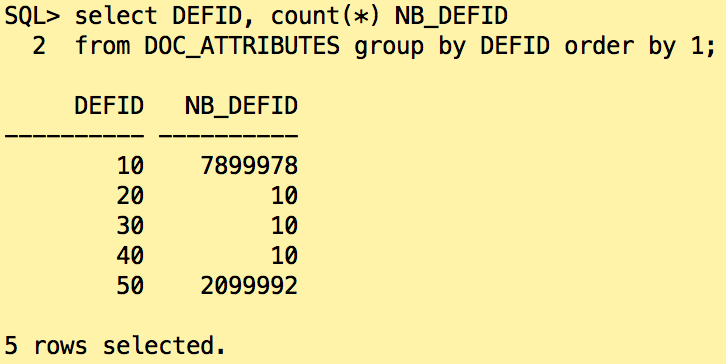
At customer site, some categories are not used as final category of the documents so most of the documents belong into a set of category and the other ones don’t have many rows.
An index is created on the column DEFID to help Oracle retrieving the rows during a search based on category.
![]()
Behavior in Oracle 11g
Let’s gather the statistics on that table:
![]()
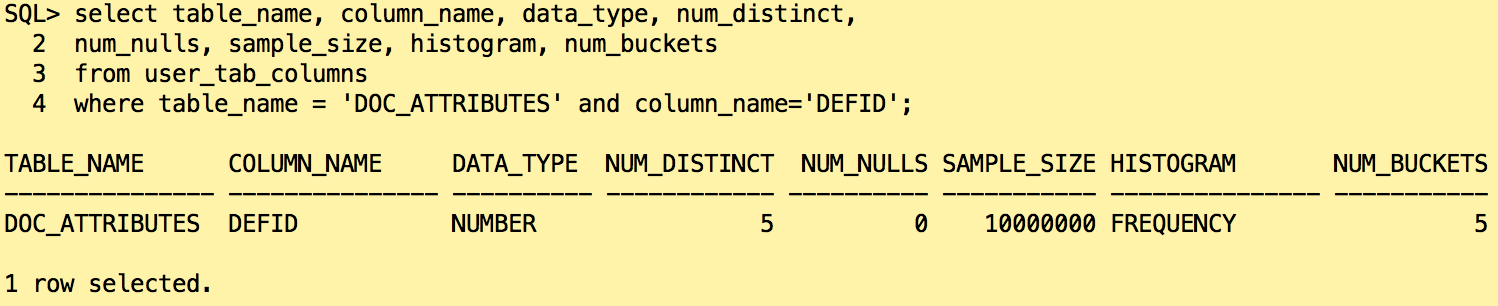
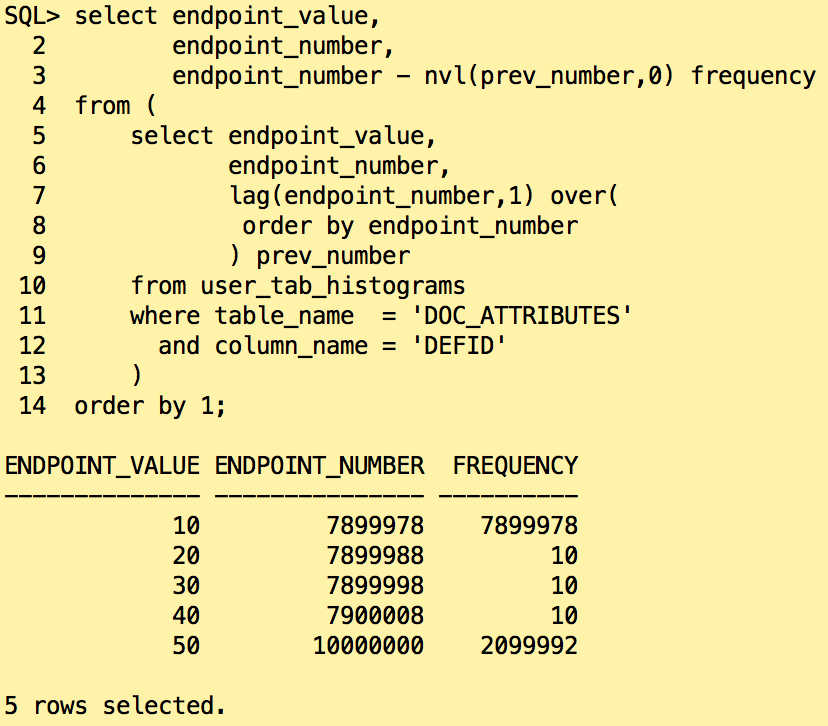
What if we check the statistics in the dictionnary?
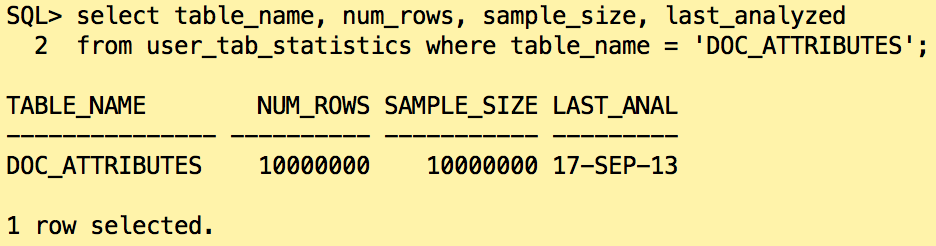
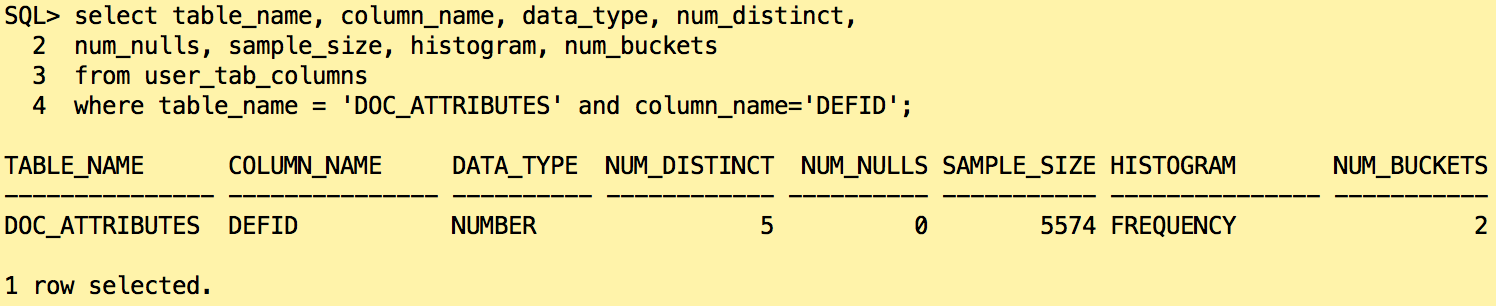
Oracle created as expected an frequency histogram on the column DEFID because we have less than 254 distinct values. It found 5 distinct values for that column but only created 2 buckets in histogram.
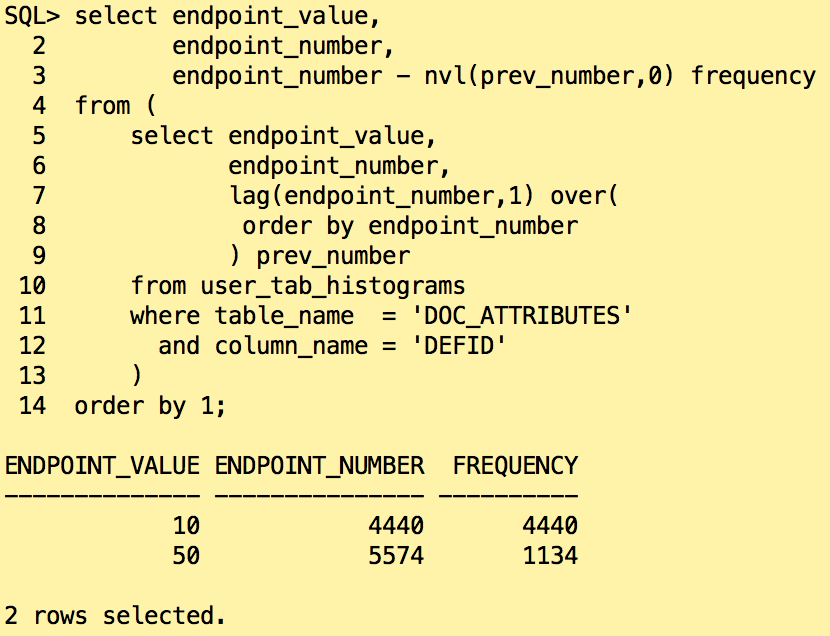
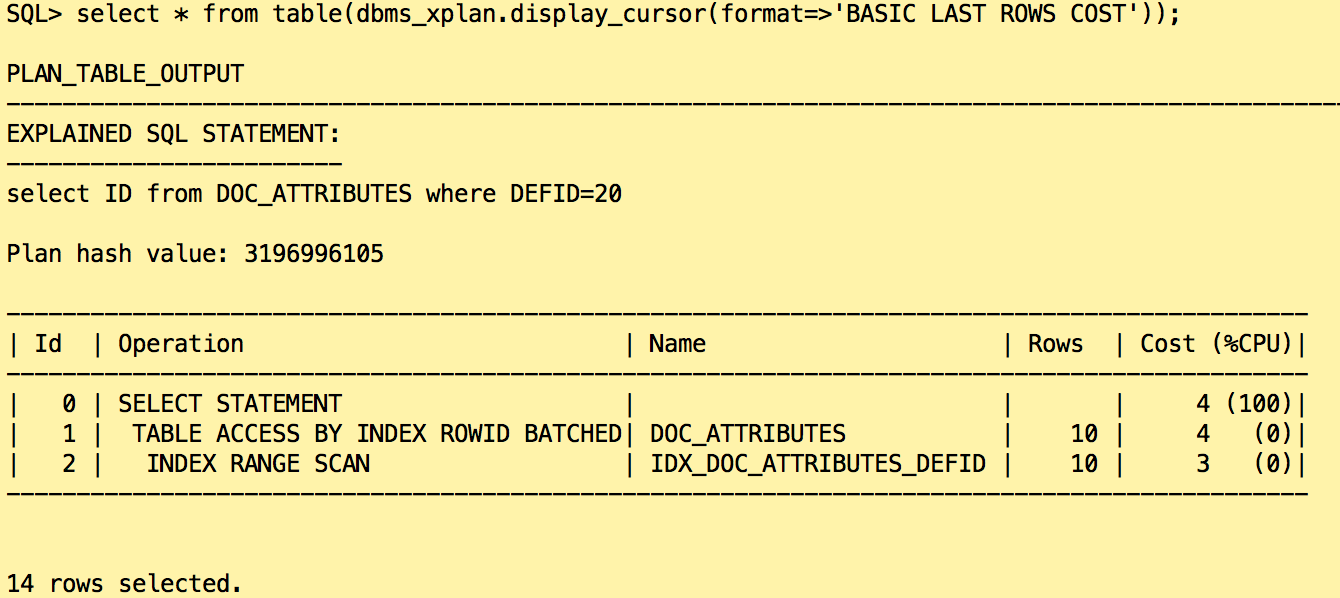
The categories with the ids 20, 30 and 40 are missing in the histogram. Only the two very popular values have been found. How Oracle will react if we look for the document ids in the category “20”?
![]()
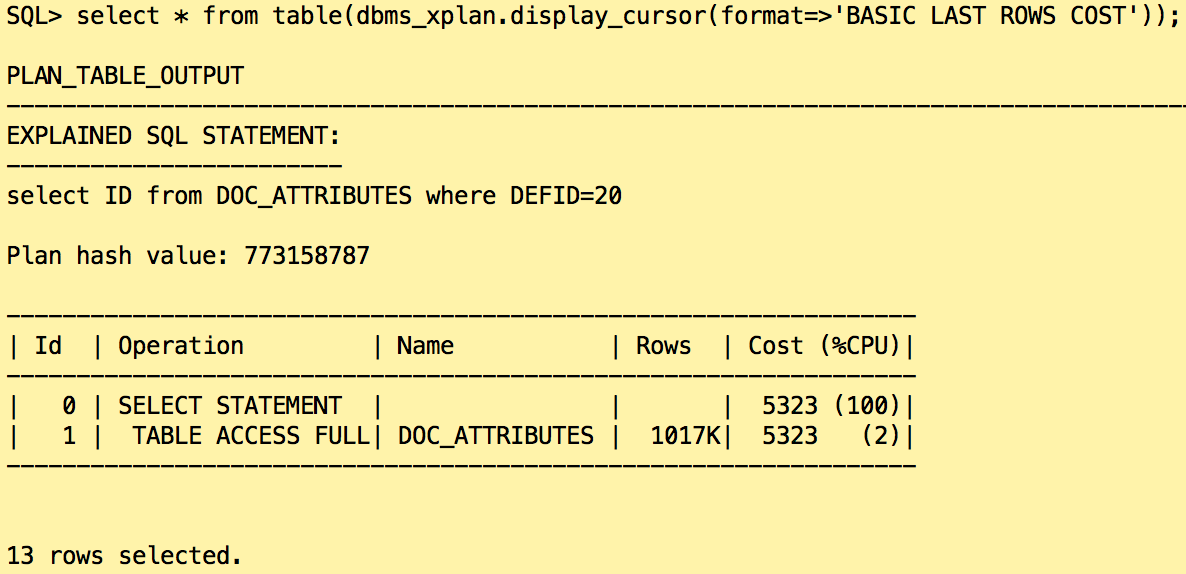
Even if an index is present on the column DEFID, Oracle accessed the rows using FULL TABLE SCAN on the table DOC_ATTRIBUTES.
Why? Because of the estimations, Oracle expected more than 1 million rows. As the value is missing in the histogram, Oracle took the least popular value and divided the frequency by 2.
The statement is started on a regularly basis so reading 10 million rows is really not an efficient way of getting only hundreds of them. The solution was to gather a correct histogram with estimate_percent set to 100. Then if it’s not stable, you can lock that histogram if it describes well enough your data.
Behavior in Oracle 12c
On the exact same table, we gather statistics in the same way as in 11g
![]()
Let’s have a look on the statistics:
In 12c, Oracle was able to find 5 distinct values and that time created an histogram with 5 buckets as expected.
When gathering statistics on a table, Oracle uses an algorithm to approximate the number of distinct values (ANDV). It scans the table looking for all possible different values. Unlike in 11g, Oracle use at its advantage that scan in 12c to create the histogram resulting in a much better precision.
Let’s have a look on the histogram:
All 5 categories are present in the histogram will the exact number of rows. The histogram is now describing exactly the data is the table. What is the plan is we run the same query as before?
![]()
In that case, the estimation is exact, Oracle used the histogram to get the number of rows returned when DEFID = 20. Reading 10 rows in the index is more efficient than reading the whole table.
You can download the scripts to replay the demo just following the link: Script_Histogram_Precision.zip
Conclusion
Giving the right information to the optimizer is essential. If some information is missing, the optimizer has to guess what the data is looking like and can make big mistakes.
Pay attention on the generated histogram and their precision because it can be a source of trouble in your environment.
![Thumbnail [60x60]](https://www.dbi-services.com/blog/wp-content/uploads/2022/11/NIJ-min-scaled.jpg)
![Thumbnail [90x90]](https://www.dbi-services.com/blog/wp-content/uploads/2022/08/OLS_web-min-scaled.jpg)