By Franck Pachot
.
I never remember that in order to use instance caging you need to set a Resource Manager Plan but don’t need to set CPU_COUNT explicitly (was it the case in previous versions?). Here is how to test it quickly in a lab.
SQL> startup force
ORACLE instance started.

SQL> show spparameter resource_manager_plan

SID      NAME                          TYPE        VALUE
-------- ----------------------------- ----------- ----------------------------
*        resource_manager_plan         string

SQL> show spparameter cpu_count

SID      NAME                          TYPE        VALUE
-------- ----------------------------- ----------- ----------------------------
*        cpu_count                     integer

SQL> show parameter resource_manager_plan

NAME                                 TYPE        VALUE
------------------------------------ ----------- ------------------------------
resource_manager_plan                string

SQL> show parameter cpu_count

NAME                                 TYPE        VALUE
------------------------------------ ----------- ------------------------------
cpu_count                            integer     16
I have a VM with 16 CPU threads, no “cpu_count” or “resource_manager_plan” are set in SPFILE. I restarted the instance (it is a lab) to be sure that nothing is set on scope=memory.
sqlplus / as sysdba @ tmp.sql /dev/null
for i in {1..16} ; do echo "exec loop null; end loop;" | sqlplus -s "c##franck/c##franck" & done >/dev/null
sleep 10
( cd /tmp && git clone https://github.com/tanelpoder/tpt-oracle.git )
sqlplus / as sysdba @ /tmp/tpt-oracle/snapper ash=event+username 30 1 all < /dev/null
pkill -f oracleCDB1A
I run 32 sessions working in memory (simple PL/SQL loops) and look at the sessions with Tanel Poder’s snapper in order to show whether I am ON CPU or in Resource Manager wait. And then kill my sessions in a very hugly fashion (this is a lab)
Nothing set, all defaults: no instance caging
-- Session Snapper v4.31 - by Tanel Poder ( http://blog.tanelpoder.com/snapper ) - Enjoy the Most Advanced Oracle Troubleshooting Script on the Planet! :)

-------------------------------------------------------------------------------
  ActSes   %Thread | EVENT                               | USERNAME
-------------------------------------------------------------------------------
   16.00   (1600%) | ON CPU                              | C##FRANCK
   16.00   (1600%) | ON CPU                              | SYS

--  End of ASH snap 1, end=2021-03-16 17:38:43, seconds=30, samples_taken=96, AAS=32
On my CPU_COUNT=16 (default but not set) instance, I have 32 sessions ON CPU -> no instance caging
Only CPU_COUNT set, no resource manager plan: no instance caging
SQL> alter system set cpu_count=16  scope=memory;
System altered.
I have set CPU_COUNT explicitely to 16 (just checking because this is where I always have a doubt)
-- Session Snapper v4.31 - by Tanel Poder ( http://blog.tanelpoder.com/snapper ) - Enjoy the Most Advanced Oracle Troubleshooting Script on the Planet! :)

-------------------------------------------------------------------------------
  ActSes   %Thread | EVENT                               | USERNAME
-------------------------------------------------------------------------------
   16.00   (1600%) | ON CPU                              | C##FRANCK
   16.00   (1600%) | ON CPU                              | SYS
     .03      (3%) | ON CPU                              |

--  End of ASH snap 1, end=2021-03-16 18:03:50, seconds=5, samples_taken=37, AAS=32
Setting CPU_COUNT manually doesn’t change anything here.
SQL> startup force
ORACLE instance started.
For the next test I reset to the default to show that CPU_COUNT doesn’t have to be set explicitely in order to enable instance caging.
Resource manager set to DEFAULT_CDB_PLAN with default CPU_COUNT: instance caging
SQL> alter system set resource_manager_plan=DEFAULT_CDB_PLAN scope=memory;

System altered.
I have set the default resource manager plan (I’m in multitenant and running from the CDB)
-- Session Snapper v4.31 - by Tanel Poder ( http://blog.tanelpoder.com/snapper ) - Enjoy the Most Advanced Oracle Troubleshooting Script on the Planet! :)

-------------------------------------------------------------------------------
  ActSes   %Thread | EVENT                               | USERNAME
-------------------------------------------------------------------------------
   13.07   (1307%) | ON CPU                              | SYS
   12.20   (1220%) | resmgr:cpu quantum                  | C##FRANCK
    3.80    (380%) | ON CPU                              | C##FRANCK
    2.93    (293%) | resmgr:cpu quantum                  | SYS

--  End of ASH snap 1, end=2021-03-16 18:21:24, seconds=30, samples_taken=94, AAS=32
Here only 16 sessions on average are ON CPU and the others are scheduled out by Resource Manager. Note that there’s a higher priority for SYS than for my user.
Resource manager set to DEFAULT_MAINTENANCE_PLAN with default CPU_COUNT: instance caging
SQL> alter system set resource_manager_plan=DEFAULT_MAINTENANCE_PLAN scope=memory;

System altered.
I have set the default resource manager plan (I’m in multitenant and running from the CDB)
-- Session Snapper v4.31 - by Tanel Poder ( http://blog.tanelpoder.com/snapper ) - Enjoy the Most Advanced Oracle Troubleshooting Script on the Planet! :)

-------------------------------------------------------------------------------
  ActSes   %Thread | EVENT                               | USERNAME
-------------------------------------------------------------------------------
   13.22   (1322%) | ON CPU                              | SYS
   12.31   (1231%) | resmgr:cpu quantum                  | C##FRANCK
    3.69    (369%) | ON CPU                              | C##FRANCK
    2.78    (278%) | resmgr:cpu quantum                  | SYS
     .07      (7%) | ON CPU                              |
     .04      (4%) | resmgr:cpu quantum                  |

--  End of ASH snap 1, end=2021-03-16 18:29:31, seconds=30, samples_taken=95, AAS=32.1
Here only 16 sessions on average are ON CPU and the others are scheduled out by Resource Manager. Again, there’s a higher priority for SYS than for my user.
Same in a PDB
for i in {1..16} ; do echo "exec loop null; end loop;" | ORACLE_PDB_SID=PDB1 sqlplus -s / as sysdba & done >/dev/null
for i in {1..16} ; do echo "exec loop null; end loop;" | sqlplus -s "c##franck/c##franck"@//localhost/PDB1 & done >/dev/null
I’ve changed my connections to connect to the PDB
-- Session Snapper v4.31 - by Tanel Poder ( http://blog.tanelpoder.com/snapper ) - Enjoy the Most Advanced Oracle Troubleshooting Script on the Planet! :)


----------------------------------------------------------------------------------------
  ActSes   %Thread | EVENT                               | USERNAME             | CON_ID
----------------------------------------------------------------------------------------
   14.95   (1495%) | ON CPU                              | SYS                  |      3
   14.27   (1427%) | resmgr:cpu quantum                  | C##FRANCK            |      3
    1.73    (173%) | ON CPU                              | C##FRANCK            |      3
    1.05    (105%) | resmgr:cpu quantum                  | SYS                  |      3
     .01      (1%) | LGWR all worker groups              |                      |      0
     .01      (1%) | ON CPU                              |                      |      0

--  End of ASH snap 1, end=2021-03-16 19:14:52, seconds=30, samples_taken=93, AAS=32
I check the CON_ID to verify that I run in the PDB and here, with the CDB resource manager plan DEFAULT_MAINTENANCE_PLAN the SYS_GROUP (SYSDBA and SYSTEM) can take 90% of CPU. It is the same with DEFAULT_CDB_PLAN.
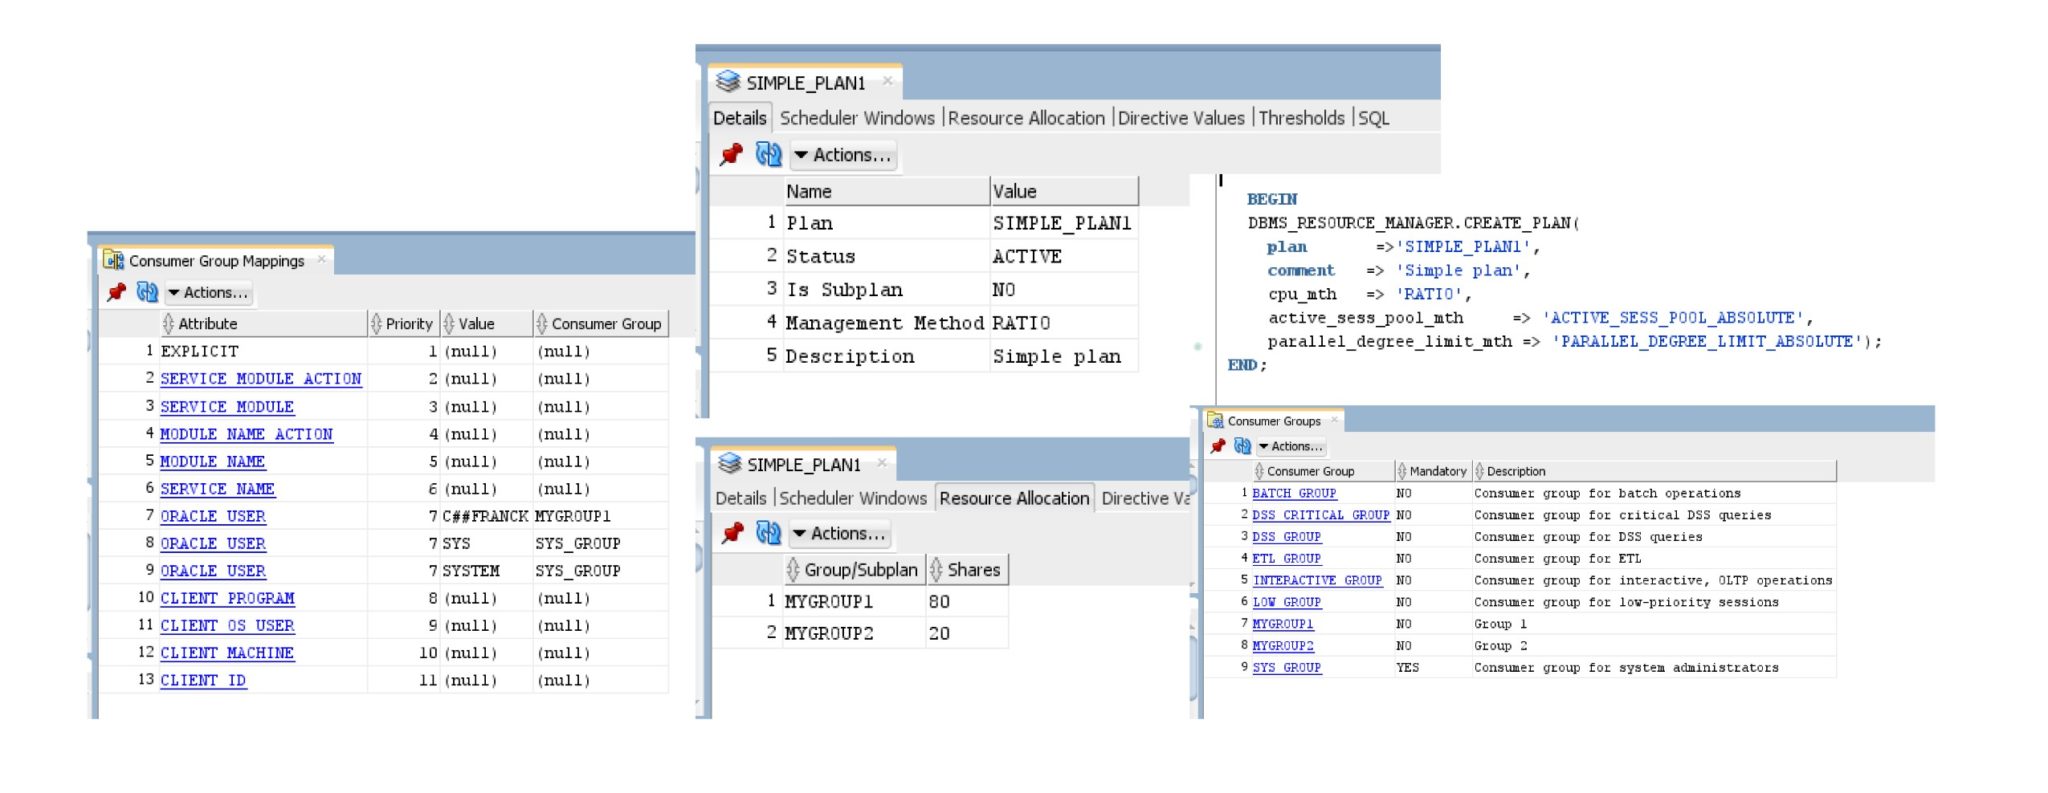
Adding a Simple Plan
SQL> alter session set container=PDB1;

Session altered.

SQL> BEGIN
  2  DBMS_RESOURCE_MANAGER.CREATE_SIMPLE_PLAN(SIMPLE_PLAN => 'SIMPLE_PLAN1',
  3     CONSUMER_GROUP1 => 'MYGROUP1', GROUP1_PERCENT => 80,
  4     CONSUMER_GROUP2 => 'MYGROUP2', GROUP2_PERCENT => 20);
  5  END;
  6  /

PL/SQL procedure successfully completed.

SQL> alter system set resource_manager_plan=SIMPLE_PLAN1 scope=memory;

System altered.
This is the simple plan example from the documentation (or here).
-- Session Snapper v4.31 - by Tanel Poder ( http://blog.tanelpoder.com/snapper ) - Enjoy the Most Advanced Oracle Troubleshooting Script on the Planet! :)

----------------------------------------------------------------------------------------
  ActSes   %Thread | EVENT                               | USERNAME             | CON_ID
----------------------------------------------------------------------------------------
    8.59    (859%) | ON CPU                              | SYS                  |      3
    8.51    (851%) | ON CPU                              | C##FRANCK            |      3
    7.49    (749%) | resmgr:cpu quantum                  | C##FRANCK            |      3
    7.41    (741%) | resmgr:cpu quantum                  | SYS                  |      3
     .04      (4%) | ON CPU                              |                      |      0

--  End of ASH snap 1, end=2021-03-16 19:29:54, seconds=30, samples_taken=92, AAS=32
Now, with this simple plan, everything changed. The level 1 gives 100% to SYS_GROUP but it actually got 50%. Level 2 gives 80% and 20% to groups that are not used there. And level 3 gives 100% to OTHER_GROUPS. But those are the levels documented in pre-multitenant.
Mapping my user to one simple plan group
SQL> BEGIN
  2  DBMS_RESOURCE_MANAGER.create_pending_area;
  3  DBMS_RESOURCE_MANAGER.SET_CONSUMER_GROUP_MAPPING
  4       (DBMS_RESOURCE_MANAGER.ORACLE_USER, 'C##FRANCK', 'MYGROUP2');
  5  DBMS_RESOURCE_MANAGER.validate_pending_area;
  6  DBMS_RESOURCE_MANAGER.submit_pending_area;
  7  END;
  8  /

PL/SQL procedure successfully completed.
I’ve assigned my C##FRANCK user which gets 20% at level 2
-- Session Snapper v4.31 - by Tanel Poder ( http://blog.tanelpoder.com/snapper ) - Enjoy the Most Advanced Oracle Troubleshooting Script on the Planet! :)

----------------------------------------------------------------------------------------
  ActSes   %Thread | EVENT                               | USERNAME             | CON_ID
----------------------------------------------------------------------------------------
   13.20   (1320%) | ON CPU                              | C##FRANCK            |      3
   12.78   (1278%) | resmgr:cpu quantum                  | SYS                  |      3
    3.22    (322%) | ON CPU                              | SYS                  |      3
    2.80    (280%) | resmgr:cpu quantum                  | C##FRANCK            |      3
     .02      (2%) | resmgr:cpu quantum                  |                      |      0
     .01      (1%) | log file parallel write             |                      |      0
     .01      (1%) | ON CPU                              |                      |      0

--  End of ASH snap 1, end=2021-03-16 19:45:52, seconds=30, samples_taken=96, AAS=32
Now my user got 80% of the CPU resource and SYS only 20%
Surprised? In a CDB the “simple plan” is the the same as described in pre-12c documentation – there’s only one level, and 80/20 shares:
The main message here is: test it because what you get may not be what you think… Test and keep it simple.
![Thumbnail [60x60]](https://www.dbi-services.com/blog/wp-content/uploads/2022/12/oracle-square.png)
![Thumbnail [90x90]](https://www.dbi-services.com/blog/wp-content/uploads/2022/08/DWE_web-min-scaled.jpg)
![Thumbnail [90x90]](https://www.dbi-services.com/blog/wp-content/uploads/2022/08/JDU_web-min-scaled.jpg)