Monitoring is a crucial element of DevOps automation that has to be proactive, meaning it must find ways to improve applications quality before bugs appear.
Therefore, we have to quickly and easily understand what is happening in our infrastructure, which is often more and more complex and constantly evolving.
In this context, one tool stands out: Prometheus.
Prometheus is an open-source, metrics-based monitoring system and alerting tool. It collects data about applications and systems in a TSDB and allows you to visualise the data and much more.
Of course, Prometheus is far from the only one of those out there. This is why I suggest you dive in to a series of monitoring blogs on a tool that has the wind in its sails.
Download and Install Prometheus
In this billet, we will lay the foundations, starting with the installation of Prometheus hosted on a UNIX server (Red Hat Enterprise Linux release 8.5).
We will focus specifically on the installation of Prometheus. We will cover the configuration part in another blog.
Download the pre-compiled binaries
First of all, let’s download the latest binaries available on the official website, which is version “2.32.0-rc.0” (more precisely a pre-release)
[nla@DBI-POC prometheus]$ mkdir -p /share/prometheus; chmod -R 755 share; cd /share/prometheus
[nla@DBI-POC prometheus]$ wget https://github.com/prometheus/prometheus/releases/download/v2.32.0-rc.0/prometheus-2.32.0-rc.0.linux-amd64.tar.gz

--2021-12-06 16:08:04--  https://github.com/prometheus/prometheus/releases/download/v2.32.0-rc.0/prometheus-2.32.0-rc.0.linux-amd64.tar.gz
Resolving github.com (github.com)... 140.82.121.3
Connecting to github.com (github.com)|140.82.121.3|:443... connected.
HTTP request sent, awaiting response... 302 Found
Location: https://objects.githubusercontent.com/github-production-release-asset-2e65be/6838921/d4b11ccb-c6e4-4401-9d93-1da7f6716c24?X-Amz-Algorithm=AWS4-HMAC-SHA256&X-Amz-Credential=AKIAIWNJYAX4CSVEH53A%2F20211206%2Fus-east-1%2Fs3%2Faws4_request&X-Amz-Date=20211206T150804Z&X-Amz-Expires=300&X-Amz-Signature=56868964a039ed2a6aa1a75620956a1df24099821adc9b8b9e7a525e20df13c4&X-Amz-SignedHeaders=host&actor_id=0&key_id=0&repo_id=6838921&response-content-disposition=attachment%3B%20filename%3Dprometheus-2.32.0-rc.0.linux-amd64.tar.gz&response-content-type=application%2Foctet-stream [following]
--2021-12-06 16:08:04--  https://objects.githubusercontent.com/github-production-release-asset-2e65be/6838921/d4b11ccb-c6e4-4401-9d93-1da7f6716c24?X-Amz-Algorithm=AWS4-HMAC-SHA256&X-Amz-Credential=AKIAIWNJYAX4CSVEH53A%2F20211206%2Fus-east-1%2Fs3%2Faws4_request&X-Amz-Date=20211206T150804Z&X-Amz-Expires=300&X-Amz-Signature=56868964a039ed2a6aa1a75620956a1df24099821adc9b8b9e7a525e20df13c4&X-Amz-SignedHeaders=host&actor_id=0&key_id=0&repo_id=6838921&response-content-disposition=attachment%3B%20filename%3Dprometheus-2.32.0-rc.0.linux-amd64.tar.gz&response-content-type=application%2Foctet-stream
Resolving objects.githubusercontent.com (objects.githubusercontent.com)... 185.199.108.133, 185.199.109.133, 185.199.111.133, ...
Connecting to objects.githubusercontent.com (objects.githubusercontent.com)|185.199.108.133|:443... connected.
HTTP request sent, awaiting response... 200 OK
Length: 75092211 (72M) [application/octet-stream]
Saving to: 'prometheus-2.32.0-rc.0.linux-amd64.tar.gz'

prometheus-2.32.0-rc.0.linux-amd64.tar.gz                                                                                  100%[======================================================================================================================================================================================================================================================================================================================================>]  71.61M  9.15MB/s    in 9.4s

2021-12-06 16:08:14 (7.61 MB/s) - 'prometheus-2.32.0-rc.0.linux-amd64.tar.gz' saved [75092211/75092211]
[nla@DBI-POC prometheus]$
Once the binaries are downloaded, let’s uncompress the tarball.
[nla@DBI-POC prometheus]$ tar -xvf prometheus-2.32.0-rc.0.linux-amd64.tar.gz
prometheus-2.32.0-rc.0.linux-amd64/
prometheus-2.32.0-rc.0.linux-amd64/consoles/
prometheus-2.32.0-rc.0.linux-amd64/consoles/index.html.example
prometheus-2.32.0-rc.0.linux-amd64/consoles/node-cpu.html
prometheus-2.32.0-rc.0.linux-amd64/consoles/node-disk.html
prometheus-2.32.0-rc.0.linux-amd64/consoles/node-overview.html
prometheus-2.32.0-rc.0.linux-amd64/consoles/node.html
prometheus-2.32.0-rc.0.linux-amd64/consoles/prometheus-overview.html
prometheus-2.32.0-rc.0.linux-amd64/consoles/prometheus.html
prometheus-2.32.0-rc.0.linux-amd64/console_libraries/
prometheus-2.32.0-rc.0.linux-amd64/console_libraries/menu.lib
prometheus-2.32.0-rc.0.linux-amd64/console_libraries/prom.lib
prometheus-2.32.0-rc.0.linux-amd64/prometheus.yml
prometheus-2.32.0-rc.0.linux-amd64/LICENSE
prometheus-2.32.0-rc.0.linux-amd64/NOTICE
prometheus-2.32.0-rc.0.linux-amd64/prometheus
prometheus-2.32.0-rc.0.linux-amd64/promtool
[nla@DBI-POC prometheus]$
Now, let’s create our system account called prometheus
sudo useradd -M -r -s /bin/false prometheus
We will use mkdir to create some directories to store the configuration and other files needed by Prometheus and store the data.
sudo mkdir /etc/prometheus /data/prometheus
Move the files from the downloaded archive to the appropriate locations, and set ownership to the prometheus system account:
[nla@DBI-POC prometheus]$sudo cp prometheus-2.32.0-rc.0.linux-amd64/{prometheus,promtool} /usr/local/bin/
[nla@DBI-POC prometheus]$sudo chown prometheus:prometheus /usr/local/bin/{prometheus,promtool}
[nla@DBI-POC prometheus]$sudo cp -r prometheus-2.32.0-rc.0.linux-amd64/{consoles,console_libraries} /etc/prometheus/
[nla@DBI-POC prometheus]$sudo cp prometheus-2.32.0-rc.0.linux-amd64/prometheus.yml /etc/prometheus/prometheus.yml
[nla@DBI-POC prometheus]$sudo chown -R prometheus:prometheus /etc/prometheus
[nla@DBI-POC prometheus]$sudo chown prometheus:prometheus /data/prometheus
Half the work is done; let’s run Prometheus configured by default in the foreground just to make sure everything is set up correctly :
[nla@DBI-POC prometheus]$prometheus --config.file=/etc/prometheus/prometheus.yml

ts=2021-12-06T17:13:06.171Z caller=main.go:406 level=info msg="No time or size retention was set so using the default time retention" duration=15d
ts=2021-12-06T17:13:06.171Z caller=main.go:444 level=info msg="Starting Prometheus" version="(version=2.31.1, branch=HEAD, revision=411021ada9ab41095923b8d2df9365b632fd40c3)"
ts=2021-12-06T17:13:06.172Z caller=main.go:449 level=info build_context="(go=go1.17.3, user=root@9419c9c2d4e0, date=20211105-20:35:02)"
ts=2021-12-06T17:13:06.172Z caller=main.go:450 level=info host_details="(Linux 4.18.0-348.2.1.el8_5.x86_64 #1 SMP Mon Nov 8 13:30:15 EST 2021 x86_64 DBI-POC.localdomain (none))"
ts=2021-12-06T17:13:06.172Z caller=main.go:451 level=info fd_limits="(soft=1024, hard=262144)"
ts=2021-12-06T17:13:06.172Z caller=main.go:452 level=info vm_limits="(soft=unlimited, hard=unlimited)"
ts=2021-12-06T17:13:06.173Z caller=web.go:542 level=info component=web msg="Start listening for connections" address=0.0.0.0:9090
ts=2021-12-06T17:13:06.173Z caller=main.go:839 level=info msg="Starting TSDB ..."
ts=2021-12-06T17:13:06.175Z caller=tls_config.go:195 level=info component=web msg="TLS is disabled." http2=false
ts=2021-12-06T17:13:06.176Z caller=head.go:479 level=info component=tsdb msg="Replaying on-disk memory mappable chunks if any"
ts=2021-12-06T17:13:06.176Z caller=head.go:513 level=info component=tsdb msg="On-disk memory mappable chunks replay completed" duration=1.628µs
ts=2021-12-06T17:13:06.176Z caller=head.go:519 level=info component=tsdb msg="Replaying WAL, this may take a while"
ts=2021-12-06T17:13:06.177Z caller=head.go:590 level=info component=tsdb msg="WAL segment loaded" segment=0 maxSegment=0
ts=2021-12-06T17:13:06.177Z caller=head.go:596 level=info component=tsdb msg="WAL replay completed" checkpoint_replay_duration=22.185µs wal_replay_duration=770.195µs total_replay_duration=818.18µs
ts=2021-12-06T17:13:06.177Z caller=main.go:866 level=info fs_type=XFS_SUPER_MAGIC
ts=2021-12-06T17:13:06.178Z caller=main.go:869 level=info msg="TSDB started"
ts=2021-12-06T17:13:06.178Z caller=main.go:996 level=info msg="Loading configuration file" filename=/etc/prometheus/prometheus.yml
ts=2021-12-06T17:13:06.186Z caller=main.go:1033 level=info msg="Completed loading of configuration file" filename=/etc/prometheus/prometheus.yml totalDuration=8.409684ms db_storage=1.003µs remote_storage=1.343µs web_handler=271ns query_engine=700ns scrape=8.118036ms scrape_sd=23.72µs notify=23.188µs notify_sd=8.332µs rules=1.081µs
ts=2021-12-06T17:13:06.186Z caller=main.go:811 level=info msg="Server is ready to receive web requests."
Here, we can see the message saying, “The server is ready to receive web requests, ” confirming that our application is running well.
Send a break to stop the process (Press Ctrl+C).
Configure Prometheus service file
Create a systemd unit file for Prometheus:
[nla@DBI-POC prometheus]$sudo vi /etc/systemd/system/prometheus.service
Define the Prometheus service in the unit file:
[Unit]
Description=Prometheus Time Series Collection and Processing Server
Wants=network-online.target
After=network-online.target
[Service]
User=prometheus
Group=prometheus
Type=simple
ExecStart=/usr/local/bin/prometheus \
--config.file /etc/prometheus/prometheus.yml \
--storage.tsdb.path /data/prometheus/ \
--web.page-title="blog.dbi-services: Prometheus Time Series Collection and Processing Server"
--web.enable-lifecycle \
--web.console.templates=/etc/prometheus/consoles \
--web.console.libraries=/etc/prometheus/console_libraries
[Install]
WantedBy=multi-user.target
After saving and exiting the file, we will ensure that Systemd has considered the changes we have made.
[nla@DBI-POC prometheus]$sudo systemctl daemon-reload
Start the Prometheus service:
[nla@DBI-POC prometheus]$sudo systemctl start prometheus
Think about enable the Prometheus service to allow it starting automatically at boot:
[nla@DBI-POC prometheus]$sudo systemctl enable prometheus
Verify the Prometheus service is healthy:
[nla@DBI-POC prometheus]$ sudo systemctl status prometheus
● prometheus.service - Prometheus Time Series Collection and Processing Server
   Loaded: loaded (/etc/systemd/system/prometheus.service; enabled; vendor preset: disabled)
   Active: active (running) since Tue 2021-12-07 10:02:32 CET; 6s ago
 Main PID: 45138 (prometheus)
    Tasks: 10 (limit: 49348)
   Memory: 92.4M
   CGroup: /system.slice/prometheus.service
           └─45138 /usr/local/bin/prometheus --config.file /etc/prometheus/prometheus.yml --storage.tsdb.path /data/prometheus/ --web.enable-lifecycle --web.page-title=blog.dbi-services: Prometheus Time Series Collection and Processing Server --web.console.templates=/etc/prometheus/consoles --web.console.libraries=/etc/prometheus/console_libraries

Dec 07 10:02:38 DBI-POC.localdomain prometheus[45138]: ts=2021-12-07T09:02:38.100Z caller=compact.go:518 level=info component=tsdb msg="write block" mint=1638806408045 maxt=1638813600000 ulid=01FPA22V00F7PTC3WFWNJYT653 duration=20.355646ms
Dec 07 10:02:38 DBI-POC.localdomain prometheus[45138]: ts=2021-12-07T09:02:38.102Z caller=head.go:803 level=info component=tsdb msg="Head GC completed" duration=930.334µs
Dec 07 10:02:38 DBI-POC.localdomain prometheus[45138]: ts=2021-12-07T09:02:38.102Z caller=checkpoint.go:97 level=info component=tsdb msg="Creating checkpoint" from_segment=12 to_segment=14 mint=1638813600000
Dec 07 10:02:38 DBI-POC.localdomain prometheus[45138]: ts=2021-12-07T09:02:38.111Z caller=head.go:972 level=info component=tsdb msg="WAL checkpoint complete" first=12 last=14 duration=9.387086ms
Dec 07 10:02:38 DBI-POC.localdomain prometheus[45138]: ts=2021-12-07T09:02:38.138Z caller=compact.go:459 level=info component=tsdb msg="compact blocks" count=2 mint=1638772668103 maxt=1638784800000 ulid=01FPA22V10HFAYEK62F84PPVZQ sources="[01FP82P13KRRXE2TPZBAVTEQPM 01FP82P1491P5PFA8ANPFFG8NB]" duration=26.366272ms
Dec 07 10:02:38 DBI-POC.localdomain prometheus[45138]: ts=2021-12-07T09:02:38.139Z caller=db.go:1293 level=info component=tsdb msg="Deleting obsolete block" block=01FP82P13KRRXE2TPZBAVTEQPM
Dec 07 10:02:38 DBI-POC.localdomain prometheus[45138]: ts=2021-12-07T09:02:38.141Z caller=db.go:1293 level=info component=tsdb msg="Deleting obsolete block" block=01FP82P1491P5PFA8ANPFFG8NB
Dec 07 10:02:38 DBI-POC.localdomain prometheus[45138]: ts=2021-12-07T09:02:38.164Z caller=compact.go:459 level=info component=tsdb msg="compact blocks" count=2 mint=1638727208042 maxt=1638784800000 ulid=01FPA22V1XK5XXXRPHB3396KR3 sources="[01FP77CXPC9Z3ZJVEFK2P5NPCM 01FPA22V10HFAYEK62F84PPVZQ]" duration=23.315044ms
Dec 07 10:02:38 DBI-POC.localdomain prometheus[45138]: ts=2021-12-07T09:02:38.165Z caller=db.go:1293 level=info component=tsdb msg="Deleting obsolete block" block=01FP77CXPC9Z3ZJVEFK2P5NPCM
Dec 07 10:02:38 DBI-POC.localdomain prometheus[45138]: ts=2021-12-07T09:02:38.167Z caller=db.go:1293 level=info component=tsdb msg="Deleting obsolete block" block=01FPA22V10HFAYEK62F84PPVZQ
[nla@DBI-POC prometheus]$
We can see the service is up and running, so good so far.
Make an HTTP request to Prometheus to verify it can respond. Basically, the request should return the page graph is found:
[nla@DBI-POC prometheus]$ curl http://localhost:9090/
Found.
And last but not least, open a new browser to access Prometheus by navigating to http://{YOUR IP ADDRESS}:9090. This one should open up on the Prometheus expression browser like below.
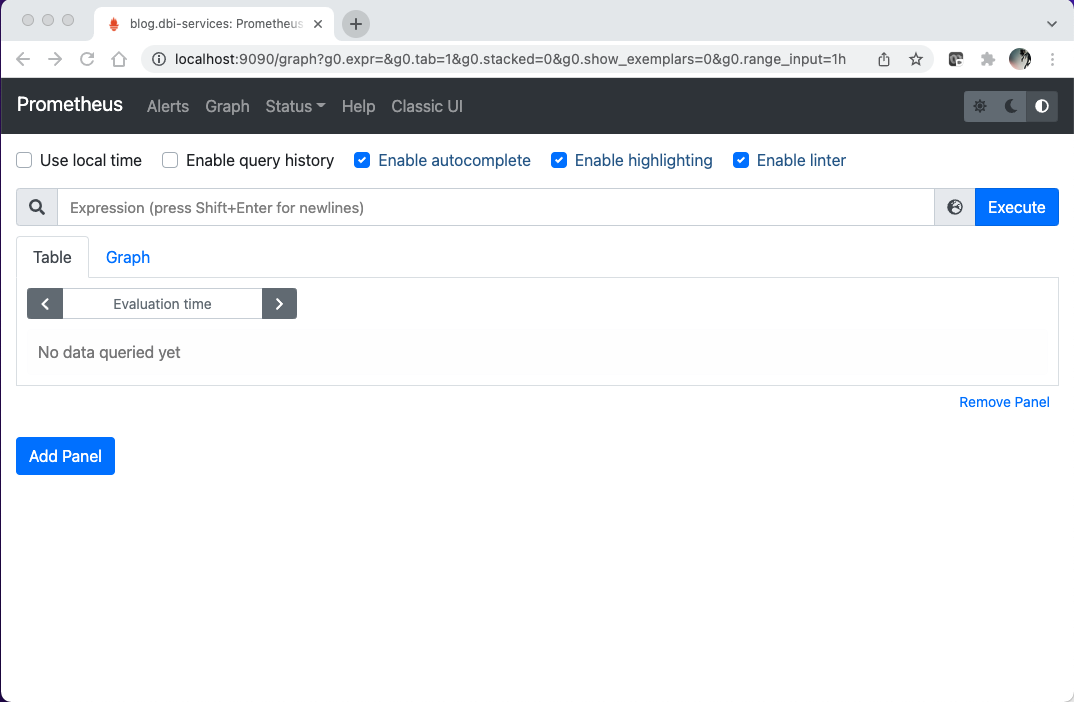
Congratulations, you have successfully installed a Prometheus; I’ll see you in a future billet to talk about the configuration of Prometheus and how we can monitor our system.
![Thumbnail [60x60]](https://www.dbi-services.com/blog/wp-content/uploads/2022/08/NLA_web-min-scaled.jpg)
![Thumbnail [90x90]](https://www.dbi-services.com/blog/wp-content/uploads/2022/08/DWE_web-min-scaled.jpg)
![Thumbnail [90x90]](https://www.dbi-services.com/blog/wp-content/uploads/2022/08/OLS_web-min-scaled.jpg)