The Enterprise Manager Cloud Control 12c is an amazing tool allowing the DBA to display a lot of informations from the console . But there are also a lot of repository views that may be consulted by the DBA to build a lot of various reports.
The Oracle Management Service collects a huge amount of raw data from the agents installed on each managed host you administer with EM 12c.
Those raw data are inserted in various tables like EM_METRIC_VALUES for example. Enterprise Manager aggregates those management data by hour and by day. Those raw data are kept 7 days; the one hour aggregated data are kept 31 days, while one day aggregated data are kept one year.
A good way to get information in the Oracle Management Repository is to build queries against the GC%METRIC% views. The GC_METRIC% views are built from EM_METRIC_VALUES. EM_METRIC_ITEMS and EM_METRIC_KEYS tables and the GC$METRIC% views are built from the GC_METRIC% views. There are a lot of GC%METRIC% views :
SQL> select distinct view_name from user_views where view_name like 'GC%METRIC%' order by 1;
GC$METRIC_CATEGORIES
GC$METRIC_COLUMNS
GC$METRIC_COLUMNS_TARGET
GC$METRIC_ERROR_CURRENT
GC$METRIC_ERROR_HISTORY
GC$METRIC_GROUPS
GC$METRIC_GROUPS_TARGET
$METRIC_KEYS
GC$METRIC_LATEST
GC$METRIC_STR_VALUES
GC$METRIC_STR_VALUES_LATEST
GC$METRIC_VALUES
GC$METRIC_VALUES_DAILY
GC$METRIC_VALUES_HOURLY
GC$METRIC_VALUES_LATEST
GC$TARGET_METRIC_COLLECTIONS
GC_METRIC_COLLECTIONS
GC_METRIC_COLUMNS
GC_METRIC_COLUMNS_TARGET
GC_METRIC_COMPOSITE_KEYS
GC_METRIC_GROUPS
GC_METRIC_GROUPS_TARGET
GC_METRIC_KEYS
GC_METRIC_LATEST
GC_METRIC_LATEST_WO_TGT
GC_METRIC_STATS_METRIC
GC_METRIC_STATS_METRIC_DAILY
GC_METRIC_STATS_TARGET
GC_METRIC_STATS_TARGET_DAILY
GC_METRIC_STR_VALUES
GC_METRIC_STR_VALUES_LATEST
GC_METRIC_STR_VALUES_WO_TGT
GC_METRIC_THRESHOLDS
GC_METRIC_VALUES
GC_METRIC_VALUES_DAILY
GC_METRIC_VALUES_HOURLY
GC_METRIC_VALUES_LATEST
GC_METRIC_VAL_HOURLY_WO_TGT
GC_RAT_TRIAL_METRIC_VALUES
GC_RAT_TRIAL_TARGET_METRICS
For example if we are interested by the load for a host, you can use the console:
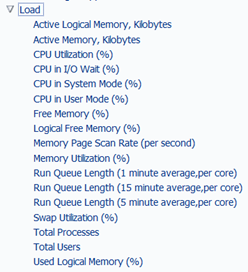
You can also find this information by querying the OMR in the view gc$metric_columns for an entity of type host and a metric_group_label of type Load:
SQL> select entity_type,metric_column_label,metric_group_label
from gc$metric_columns
where entity_type = 'host'
and metric_group_label = 'Load';
host       Active Logical Memory, Kilobytes              Load
host       Active Memory, Kilobytes                      Load
host       CPU Interrupt Time (%)                        Load
host       CPU Queue Length                              Load
host       CPU Utilization (%)                           Load
host       CPU in I/O Wait (%)                           Load
host       CPU in System Mode (%)                        Load
host       CPU in User Mode (%)                          Load
host       Free Memory (%)                               Load
host       Free Memory, Kilobytes                        Load
host       Logical Free Memory (%)                       Load
host       Memory Page Scan Rate (per second)            Load
host       Memory Utilization (%)                        Load
host       Page Transfers Rate                           Load
host       Run Queue Length (1 minute average,per core)  Load
host       Run Queue Length (15 minute average,per core) Load
host       Run Queue Length (5 minute average,per core)  Load
host       Swap Free (KB)                                Load
host       Swap Utilization (%)                          Load
host       Swap Utilization, Kilobytes                   Load
host       Total Processes                               Load
host       Total Users                                   Load
We can sort the metrics collected by entity type for example host :
SQL> select entity_type,metric_group_label
from gc$metric_columns
where entity_type = 'host'
group by entity_type,metric_group_label
order by 1,2;
host                                     All Processes
host                                     Battery details
host                                     Buffer Activity
host                                     CCCAppFileParser
host                                     CCCData_base
host                                     CCCData_group
host                                     CCCData_mapping
host                                     CCCData_obs
host                                     CCCData_queue
host                                     CCCData_warning
host                                     CCCWatchdog
host                                     CPU Usage
host                                     CPU Usage Internal
host                                     CPUs Details
host                                     Compute Node Temperature
host                                     DiscoverNow
….

Or an oracle database:
SQL> select entity_type,metric_group_label
from gc$metric_columns
where entity_type = 'oracle_database'
group by entity_type,metric_group_label
order by 1,2;

oracle_database                         ADDM Report - Global
oracle_database                         ALL Privileges
oracle_database                         ANY Privileges
oracle_database                         Access To Important Tables And Views
oracle_database                         Active Sessions by CPU and Wait Classes
oracle_database                         Alert Log
oracle_database                         Alert Log Content
oracle_database                         Alert Log Error Status
oracle_database                         Archive Area
oracle_database                         Archive Area - RAC Instance
oracle_database                         Audit Settings
oracle_database                         Audit Syslog Level
oracle_database                         AutoTask Client
oracle_database                         CPU Usage
oracle_database                         Collect SQL Response Time
oracle_database                         Connect Role
oracle_database                         Control files
oracle_database                         DB Alert Log
oracle_database                         DB Audit Files Permissions
oracle_database                         DB Control Files Permission
oracle_database                         DB Data Files Permissions
oracle_database                         DB InitParameter File Permissions
oracle_database                         DB Link Usage
oracle_database                         DB Password Setting
oracle_database                         DB Profile Setting
oracle_database                         DB Scheduler Jobs
oracle_database                         DBA Group Assignment
oracle_database                         DGPrimaryDBName
oracle_database                         Data Base parameter collection
oracle_database                         Data Failure
oracle_database                         Data Guard - 10.1 Database
oracle_database                         Data Guard - 9.2 Database
oracle_database                         Data Guard Failover
oracle_database                         Data Guard Fast-Start Failover
oracle_database                         Data Guard Fast-Start Failover Observer
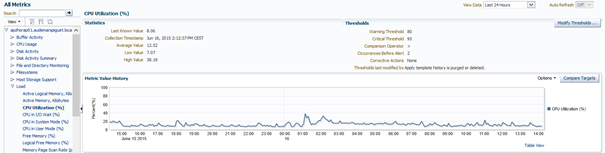
So the main interest is to collect data from those views, for example we can look more precisely in the CPU consumption for a host:
SQL> select entity_name ,collection_time,min_value as min,avg_value as avg,max_value as max
from gc$metric_values_daily
where metric_group_name = 'Load'
and metric_column_name = 'cpuUtil'
and (entity_name like '%dbserver1%' )
order by 2,1 asc;
Entity_name                 collection_time         min         avg              max
dbserver1.localdomain         01-JUN-15            3.782      17.4089931       72.284
dbserver1.localdomain         02-JUN-15            2.788      11.3085764       38.61
dbserver1.localdomain         03-JUN-15            4.16       11.7149271       28.975
dbserver1.localdomain         04-JUN-15            5.526      11.6824271       29.451
dbserver1.localdomain         05-JUN-1             5.337      10.9915486       27.319
dbserver1.localdomain         06-JUN-15            5.664      16.7499653       45.798
dbserver1.localdomain         07-JUN-15            5.021      15.4098958       84.75
dbserver1.localdomain         08-JUN-15            4.664       9.7744375       28.159
dbserver1.localdomain         09-JUN-15            4.79        9.4026805       21.113
dbserver1.localdomain         10-JUN-15            5.17        9.5937881       31.238
dbserver1.localdomain         11-JUN-15            5.162       8.8185104       16.562
dbserver1.localdomain         12-JUN-15            5.666      11.0074132       33.058
dbserver1.localdomain         13-JUN-15            6.412      15.4432917       42.709
dbserver1.localdomain         14-JUN-15            5.897       9.6474548       40.575
dbserver1.localdomain         15-JUN-15            5.675      14.5982083       34.483
For a more precise measure you can select on gc$metric_values_hourly:
SQL> select entity_name,collection_time,min_value as min,avg_value as avg,max_value as max
from gc$metric_values_hourly
where metric_group_name = 'Load'
and metric_column_name = 'cpuUtil'
and (entity_name like 'dbserver1%' )
order by 1,2
/
Entity_name              collection_time                min            avg        max
….
dbserver1.localdomain   15-JUN-15 14:00:00            15.23            18.65     22.025
dbserver1.localdomain   15-JUN-15 15:00:00             7.844            9.17     11.406
dbserver1.localdomain   15-JUN-15 16:00:00             8.635           10.76     13.625
dbserver1.localdomain   15-JUN-15 17:00:00             7.928            9.57     16.607
dbserver1.localdomain   15-JUN-15 18:00:00             8.439           13.39     21.518
dbserver1.localdomain   15-JUN-15 19:00:00             7.722           10.56     14.767
dbserver1.localdomain   15-JUN-15 20:00:00             7.993            9.09     12.934
dbserver1.localdomain   15-JUN-15 21:00:00             7.449            9.20     12.2
dbserver1.localdomain   15-JUN-15 22:00:00             8.001           10.47     16.328
dbserver1.localdomain   15-JUN-15 23:00:00             7.366            8.77     14.51
….
We can also display those values in the EM12c console:
Thus there are great possibilities to query the gc$metric_values% views in order to build reports. For example if we look at the different metric_group_label for an oracle database entity:
SQL> select distinct metric_group_label from gc$metric_values_daily
2   where entity_type = 'oracle_database' order by 1;
Alert Log Error Status
Archive Area
CPU Usage
Database Job Status
Database Limits
Database Size
Deferred Transactions
Dump Area
Efficiency
Flash Recovery
Global Cache Statistics
Interconnect Traffic
Invalid Objects by Schema
Memory Usage
Messages per buffered queue
Messages per buffered queue per subscriber
Messages per persistent queue
Messages per persistent queue per subscriber
OCM Instrumentation
Optimal SGA
PGA Allocated
Recovery Area
Response
SCN Growth Statistics
SCN Instance Statistics
SCN Max Statistics
SGA Pool Wastage
Segment Advisor Recommendations
Space usage by buffered queues
System Response Time Per Call
Tablespace Allocation
Tablespaces Full
Throughput
User Audit
User Block
User Locks
Wait Bottlenecks
Waits by Wait Class
backup_archive_log_age
datafile_backup
flashback available
incident_meter
max number of datafiles
Then we can ask for more precise measures:
SQL> select distinct key_part_1 from gc$metric_values_daily
where metric_group_name = 'wait_sess_cls'
order by 1;
Administrative
Application
Cluster
Commit
Concurrency
Configuration
Idle
Network
Other
Queueing
Scheduler
System I/O
User I/O
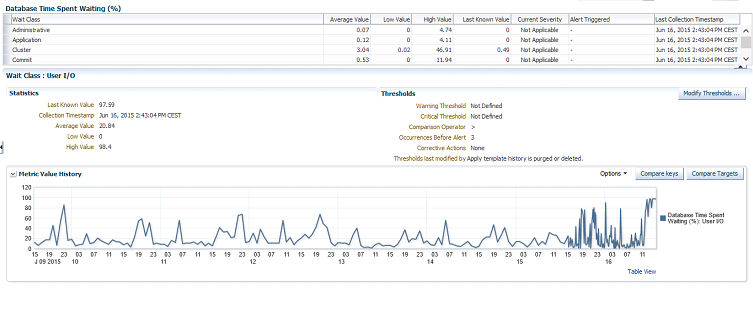
And we can write a SQL request to analyse the User I/O wait:
SQL> select collection_time,
min_value as min_wait ,
avg_value as avg_wait ,
max_value as max_wait
from gc$metric_values_daily
where metric_group_name = 'wait_sess_cls'
and metric_column_name = 'dbtime_waitclass_pct'
and (entity_name like 'dbserver1%' )
and key_part_1 = 'User I/O'
order by 1,2 asc;
Collection_time       min_wait          avg_wait          max_wait
01-JUN-15            .190094016        45.7777238        86.9431254
02-JUN-15            .026723742        49.4623178        98.6886502
03-JUN-15            .09020789          32.6063701        98.7430495
04-JUN-15            .066328202        26.342438          97.1319971
05-JUN-15            .032959651        22.7424382        96.1533236
06-JUN-15            .574570414        22.2140084        93.9315499
07-JUN-15            .022970399        20.6773665        88.9020253
08-JUN-15            .058117038        17.5328715        98.5629756
09-JUN-15            .080441214        20.5507072        98.4615166
10-JUN-15            .057529812        19.1080933        97.4292408
11-JUN-15            .038726475        21.6932703        96.48269
12-JUN-15            .106343267        25.0541945        89.5404451
13-JUN-15            .257816863        13.5371153        80.1841142
14-JUN-15            .004258955        16.5949771        84.7824337
15-JUN-15            .020058791        19.1270265        89.8952919
Naturally we find back those I/O values in the EM12c console:
Conclusion: querying the OMR views might allow Oracle DBA to build interesting reports on Hosts and Databases activities.
![Thumbnail [60x60]](https://www.dbi-services.com/blog/wp-content/uploads/2022/12/oracle-square.png)
![Thumbnail [90x90]](https://www.dbi-services.com/blog/wp-content/uploads/2022/08/DWE_web-min-scaled.jpg)