Nowadays, MySQL Databases are encapsulated into many mission critical software solutions. Lots of companies host one or many MySQL databases in their data center, sometimes even without knowing it except when the MySQL service is not available anymore. In order to increase the service availability, it is mandatory to have a monitoring solution. Regardless of if you are using MySQL Server, MySQL replication or cluster, the Oracle/MySQL monitoring solution is called MySQL Enterprise Monitor.
MySQL Enterprise Monitor 2.3
MySQL Enterprise Monitor 2.3 provides a “health view” of MySQL servers by monitoring them continuously. MySQL Enterprise Monitor does not only alert database administrators by SNMP or SMTP when errors occur, but also really helps them in their daily business: It provides real-time advice regarding performances, security vulnerabilities and availability based on best practices settings. With MySQL Query Analyzer, MySQL Enterprise Monitor provides all necessary tools to improve application performance. Besides monitoring, MySQL Enterprise Monitor provides a graphical overview of key system resources such as network IO, disk IO, and CPU usage. All this statistical information is stored in the MySQL Enterprise Monitor repository, making it easy to consult historical data and perform trend analysis.

How does MySQL Enterprise Monitor work?
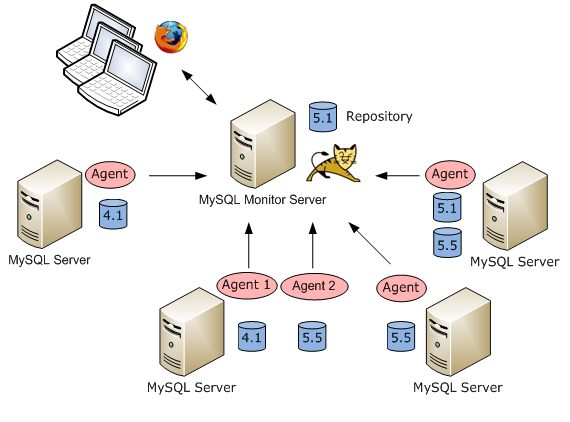
Like several monitoring tools such as Oracle Grid Control, MySQL Enterprise Monitor works with a repository, with agents installed on monitored servers, and a web interface. The schema of a typical MySQL Enterprise setup is shown below:

The core system, called MySQL Enterprise Manager, is built with a Tomcat web server. It is in charge of collecting data from MySQL Enterprise Agents. This collected data is stored in the MySQL Enterprise Monitor repository which is nothing more than a MySQL database. The web interface, MySQL Enterprise Dashboard, is realized with JSP pages. The installation of MySQL Enterprise Edition is a straightforward process thanks to a nice and clear installation utility and a good documentation guide. However, having an easy to maintain and efficient setup needs the application of best practices and deeper knowledge.
MySQL Monitor main features:
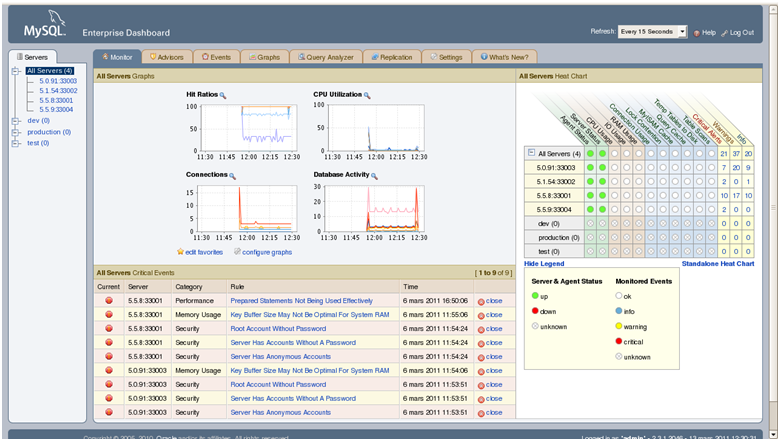
The MySQL Monitor web interface is provided by MySQL Enterprise Dashboard. MySQL Enterprise Dashboard provides a nice view of the current server status and historical events, and allows setting up the monitoring behavior. Here are the main features of MySQL Enterprise Monitor:
- Ability to monitor MySQL Database running MySQL 4.1 or higher
- Global overview through a nice web interface
- Proactive monitoring
- Alerting tool on three levels (Critical alerts, warnings, info) through SMTP and SNMP
- Historical Data Collection and Query Analyzer Data kept up to 24 months
- MySQL Query Analysis with MySQL Query Analyzer
- MySQL Cluster and MySQL replication performance monitoring
MySQL Agents setup
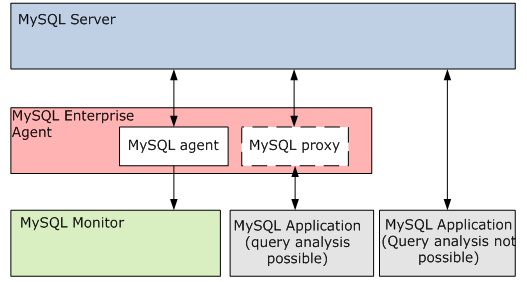
MySQL Agent is in charge of monitoring MySQL Server. This task includes checking the server accessibility but also more detailed information such as the load of the MySQL Server, variables status, operating system information and finally communicating all this information to the MySQL Enterprise Service Manager. In case of disrupted communication between these two components, MySQL Enterprise Agent is able to store data locally and send it back once the communication is re-established.
MySQL Agent can also act as proxy service; the main purpose of this architecture is to analyze queries. In this context, MySQL Agent gets queries from applications and forwards them to the MySQL Server. An agent can act as proxy server for only one server. That is why it is mandatory to setup several agents in order to do query analyses of several MySQL Server on the same physical server.

MySQL Enterprise Agent configuration is described in a single ini file as shown below:
[mysql-proxy]
# Common Parameters
 plugins=proxy,agent
 keepalive = true
log-file = mysql-mysqld4-agent.log
 pid-file=/u00/app/mysql/product/agent-2.3.1/mysql-mysqld4-agent.pid
# Agent Parameters
 agent-mgmt-hostname = http://localhost:18080/heartbeat
 agent-mgmt-username = agent
 agent-mgmt-password = manager
 mysqld-instance-dir= etc/mysqld4
 agent-item-files = share/mysql-monitor-agent/items/quan.lua,share/mysql-monitor-agent/items/items-mysql-monitor.xml,share/mysql-monitor-agent/items/items-mysql-cluster.xml,share/mysql-monitor-agent/items/custom.xml
 agent-uuid = 7f5475a8-1694-448e-b100-302451a9ca5d
#aggr-mem-baseurl=http://localhost:18080/v2/rest
# Proxy Parameters
 proxy-address=:33004
 proxy-backend-addresses = /u00/app/mysql/admin/mysqld4/socket/mysqld4.sock
 proxy-lua-script = lib/mysql-monitor-agent/lua/quan.lua
MySQL Enterprise Monitor strengths and weaknesses
MySQL Enterprise Monitor is a great tool providing lots of possibilities in terms of monitoring as already described. The main assets are the following:
- Monitoring MySQL Server from version 4.1 to 5.x, MySQL Query optimizer only for version 5.x
- Full support of MySQL Cluster and MySQL Replication, including MySQL Query Analyzer functionalities
- Plenty of monitored metrics including MySQL and operating system metrics
- Nice web interface providing a quick global overview of services availability
- Straightforward and intuitive usage
Among the main weaknesses:
- Only included as part of a MySQL Enterprise subscription (30 days trial)
- In order to use Query analyzing it is mandatory to go through a MySQL Proxy which can slow down performances
- If multiple MySQL instances are installed on the same server, it is mandatory to have several agents installed for query analyzing purposes.
I recommend the usage of MySQL Enterprise Monitor for any productive and potentially sensitive MySQL Server. This tool can of course monitor MySQL Service and therefore improve service availability. It can also help developers to improve code through the query analyzer service and therefore save significant amount of time for business activities.
![Thumbnail [60x60]](https://www.dbi-services.com/blog/wp-content/uploads/2022/08/GRS_web-min-scaled.jpg)
![Thumbnail [90x90]](https://www.dbi-services.com/blog/wp-content/uploads/2022/08/JDU_web-min-scaled.jpg)
![Thumbnail [90x90]](https://www.dbi-services.com/blog/wp-content/uploads/2022/08/JOC_web-scaled.jpg)