A couple of weeks ago, I performed a SQL Server audit and my customer talked me about a performance issue he faced only during the login phase of its application. After various exchange of information between my customer and the software editor, they noticed that this problem doesn’t occur when the application and the SQL Server instance are on the same server (less than one second with the software editor configuration against more than 10 seconds with my customer configuration). My customer was not in the same configuration than the software editor because the application server and the database server were placed separately on different servers. Moreover, my customer was very disappointed because its hardware configuration was more powerful compared to the software editor environment.
The customer’s architecture was questioned by the software editor and this can be justified here because the additional layers between the database server and the application server compared to a local configuration (shared memory is using in this case) may introduce additional latency. This is why I was introduced and but we didn’t notice any serious problem from the SQL Server infrastructure.
We decided to run a profiler trace with specific events as RPC:starting and RPC:completed events in order to capture the activity from the concerned application during the login phase.
First of all, we noticed a lot records related to the use of sp_cursorfetch method and its general poor performance is usually due to the way API Server Cursors will use it. In most situations, sp_fetchcursor calls that get 1 row at time and this is problematic with hundreds or thousands of calls to get all rows. According to the Microsoft documentation the global call architecture looks as follows:
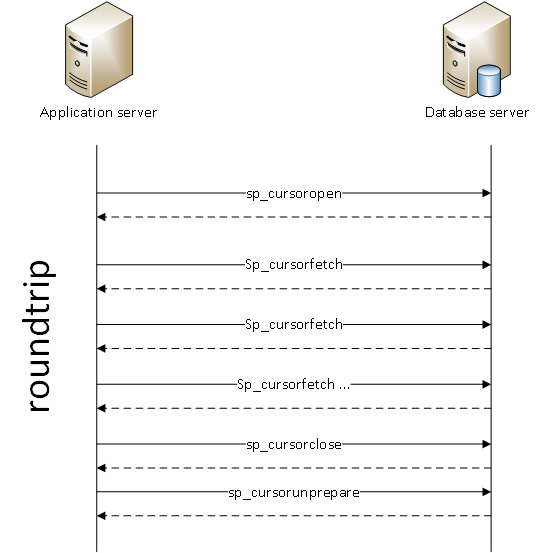
As you may see, the possible problem associated with API server cursors is excessive network round-trips. When the query returns only a single row, the API cursors may generate 3 calls, sp_cursoropen to setup the cursor, sp_cursorfetch to get the row, and sp_cursorclose to release resources used by the cursor. (The ODBC call that does this should also release resources on the client.).
So, I tried first to isolate the workload from SQL Server to the total time between to call of sp_cursorfetch method by the application. I tried to isolate the time passed by SQL Server itself from the time between two calls of the sp_cursor* methods.
with cte
as
(
	select
		row_number() over (order by t.StartTime) as num,
		case
			when t.TextData like '%sp_cursorfetch%' then 1
			else 0
		end as [sp_cursorfetch],
		case
			when t.TextData like '%sp_cursorclose%' then 1
			else 0
		end as [sp_cursorclose],
		case
			when t.TextData like '%sp_cursorprepexec%' then 1
			else 0
		end as [sp_cursorprepexec],
		case
			when t.TextData like '%sp_cursorunprepare%' then 1
			else 0
		end as [sp_cursorunprepare],
		t.*
	from sys.fn_trace_gettable('C:\Program Files\Microsoft SQL Server\MSSQL10_50.MSSQLSERVER\MSSQL\Log\dbi_trace_3.trc', null) as t
	where t.EventClass in (10 ,11)
)
select
	sum(t2.[sp_cursorprepexec]) as [sp_cursorprepexec],
	sum(t2.[sp_cursorunprepare]) as [sp_cursorunprepare],
	sum(t2.[sp_cursorfetch]) as [sp_cursorfetch],
	sum(t2.[sp_cursorclose]) as [sp_cursorclose],
	sum(t2.[sp_cursorprepexec]) + sum(t2.[sp_cursorunprepare]) + sum(t2.[sp_cursorfetch]) + sum(t2.[sp_cursorclose]) as total_events,
	sum(t2.Reads) as total_reads,
	sum(t2.Writes) as total_writes,
	sum(t2.CPU) as total_cpu_us,
	sum(t2.Duration) / 1000 as time_sql_ms,
	sum(datediff(ms, t.EndTime, t2.StartTime)) as time_external_ms
from cte as t
left join cte as t2
	on t.num = t2.num - 1;
![]()
According to the above result, the total time during the login phase corresponds to time_sql_ms + time_external_ms column values (13243 ms). We may also notice the high number of sp_cursor* calls during the login phase (roughly 8712).
Let’s do two simple maths here:
time_sql_ms / total_events = 9249 / 8712 = 1.06 ms per sp_cursor* method in average
time_external_ms /total_events = 3994 / 8712 = 0.4 ms between call in average
We can’t really notice an obvious either a network or other layers performance issue here. As a reminder, the editor software configuration is completely local and we are just constraint by the latency introduced by the RAM itself which is approximatively the nanosecond. We may understand easily that we can’t win in this case because 1ms = 1 million of nanoseconds. In other words, the local configuration may be up one million time quicker than the configuration of my customer in this case.
In this case, I recommended obviously to my customer to talk with its software editor in order to avoid using server side cursors in this case!
Hope this helps
By David Barbarin
![Thumbnail [60x60]](https://www.dbi-services.com/blog/wp-content/uploads/2022/12/microsoft-square.png)
![Thumbnail [90x90]](https://www.dbi-services.com/blog/wp-content/uploads/2022/08/NME_web-min-scaled.jpg)
![Thumbnail [90x90]](https://www.dbi-services.com/blog/wp-content/uploads/2024/01/HME_web.jpg)
![Thumbnail [90x90]](https://www.dbi-services.com/blog/wp-content/uploads/2022/10/STS_web-min-scaled.jpg)