One of the most new interesting features that will be introduced by SQL Server 2016 is certainly the query store that will complete the performance tuning toolbox of database administrators. Basically, the query store will track queries, their query plans and runtime statistics as well. It will be a great tool to detect regressing queries.
I remember a real customer case a couple of months ago where I was involved in a database migration project on SQL Server 2014. We didn’t face any serious problem during the migration: the customer’s application ran well and everyone was satisfied! However, on the next Monday morning, my customer called me because he faced suddenly a degradation of his application that slowed down with no obvious reasons. After some analysis, we found out that the problem concerned mainly deadlocks and they appeared after a database maintenance windows that included index and statistics maintenance. No luck, because it concerned a critical part of his application. To be short, one of the queries used a bad execution plan that didn’t use anymore a critical index path … very strange … Did the previous plan use it or maybe it was completely different? Has the data sufficiently changed to trigger the optimizer to pick a different plan? To be honest, no chance to figure out or to get the response here. Anyway, in order to solve this issue, the dev team modified the query and the application became to work normally after that.
But let’s go back to query store new feature. How could it help in my case? Let me show you with a little demonstration and make the things easier to understand.
First of all, to use the query store we have to enable it for the concerned database. Here I will take the well-known AdventureWorks database.
ALTER DATABASE AdventureWorks2012
SET QUERY_STORE = ON
(
	OPERATION_MODE = READ_WRITE,
	INTERVAL_LENGTH_MINUTES = 1,
	MAX_STORAGE_SIZE_MB = 5000
)
I set up 3 parameters in my case. OPERATION_MODE, INTERVAL_LENGTH_MINUTES and MAX_STORAGE_SIZE_MB that respectively correspond to operation mode (read write to be able to write to the query store), the time interval at which runtime execution statistics data is aggregated into the query store and the maximum size of the query store. You can get a complete description of the different parameters here.
Before going on, let’s take a look at the query store architecture. The following picture comes from the Conor Cunningham’s session at the last Pass Summit 2014.
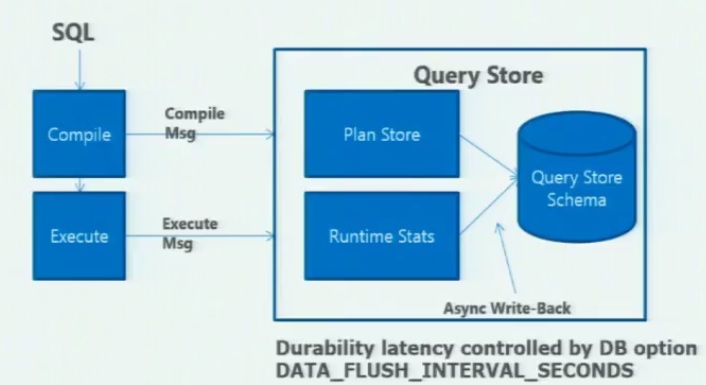
We see that the query store is a kind of recorder of the query optimizer. Each time a SQL statement or object is compiled and executed, it gets stored in the query store. Furthermore, aggregation stuff is performed in memory and to avoid overhead, data is persisted asynchronously to disk. We may change the time interval by using the DATA_FLUSH_INTERVAL_SECONDS parameter.
Go ahead and for the demo, I will take a parameter sniffing scenario that includes two prepared queries and show you how we can quickly fix it with the query store.
-- clear cache
dbcc freeproccache;
go

-- execute the first prepared query
EXECUTE sys.sp_executesql
    N'
    SELECT
        P.ProductID,
        P.Name,
        TotalQty = SUM(TH.Quantity)
    FROM Production.Product AS P
    JOIN Production.TransactionHistory AS TH
        ON TH.ProductID = P.ProductID
    WHERE
        P.Name LIKE @NameLike
    GROUP BY
        P.ProductID,
        P.Name;
    ',
    N'@NameLike nvarchar(50)',
    @NameLike = N'K%';
go


-- execute the second prepared query
-- this query will used the cached plan generated previously
EXECUTE sys.sp_executesql
    N'
    SELECT
        P.ProductID,
        P.Name,
        TotalQty = SUM(TH.Quantity)
    FROM Production.Product AS P
    JOIN Production.TransactionHistory AS TH
        ON TH.ProductID = P.ProductID
    WHERE
        P.Name LIKE @NameLike
    GROUP BY
        P.ProductID,
        P.Name;
    ',
    N'@NameLike nvarchar(50)',
    @NameLike = N'P%';
go

-- execute the third prepared query
-- this query still use the cached plan
EXECUTE sys.sp_executesql
    N'
    SELECT
        P.ProductID,
        P.Name,
        TotalQty = SUM(TH.Quantity)
    FROM Production.Product AS P
    JOIN Production.TransactionHistory AS TH
        ON TH.ProductID = P.ProductID
    WHERE
        P.Name LIKE @NameLike
    GROUP BY
        P.ProductID,
        P.Name;
    ',
    N'@NameLike nvarchar(50)',
    @NameLike = N'A%';
go

-- clear the cache in order to drop the cached plan
dbcc freeproccache

-- this query will produce a different execution plan
-- predicate is not the same
EXECUTE sys.sp_executesql
    N'
    SELECT
        P.ProductID,
        P.Name,
        TotalQty = SUM(TH.Quantity)
    FROM Production.Product AS P
    JOIN Production.TransactionHistory AS TH
        ON TH.ProductID = P.ProductID
    WHERE
        P.Name LIKE @NameLike
    GROUP BY
        P.ProductID,
        P.Name;
    ',
    N'@NameLike nvarchar(50)',
    @NameLike = N'[H-R]%';


-- re-execute the first prepared query
-- this query will use the execution plan generated previously but the performance is not the same
EXECUTE sys.sp_executesql
    N'
    SELECT
        P.ProductID,
        P.Name,
        TotalQty = SUM(TH.Quantity)
    FROM Production.Product AS P
    JOIN Production.TransactionHistory AS TH
        ON TH.ProductID = P.ProductID
    WHERE
        P.Name LIKE @NameLike
    GROUP BY
        P.ProductID,
        P.Name;
    ',
    N'@NameLike nvarchar(50)',
    @NameLike = N'K%';
go


-- re-execute the second prepared query
-- Like the first query the performance has been degraded
EXECUTE sys.sp_executesql
    N'
    SELECT
        P.ProductID,
        P.Name,
        TotalQty = SUM(TH.Quantity)
    FROM Production.Product AS P
    JOIN Production.TransactionHistory AS TH
        ON TH.ProductID = P.ProductID
    WHERE
        P.Name LIKE @NameLike
    GROUP BY
        P.ProductID,
        P.Name;
    ',
    N'@NameLike nvarchar(50)',
    @NameLike = N'P%';
go

-- execute the third prepared query
-- Like the first query the performance has been degraded
EXECUTE sys.sp_executesql
    N'
    SELECT
        P.ProductID,
        P.Name,
        TotalQty = SUM(TH.Quantity)
    FROM Production.Product AS P
    JOIN Production.TransactionHistory AS TH
        ON TH.ProductID = P.ProductID
    WHERE
        P.Name LIKE @NameLike
    GROUP BY
        P.ProductID,
        P.Name;
    ',
    N'@NameLike nvarchar(50)',
    @NameLike = N'A%';
go
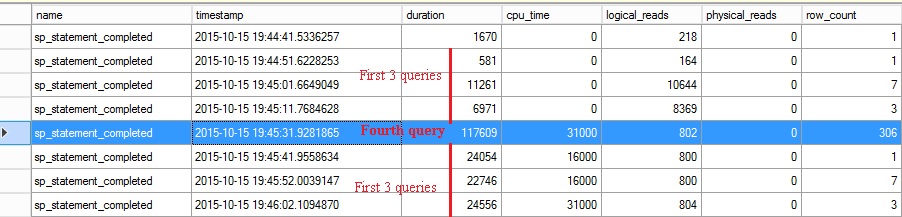
In this scenario, the first query is executed and the query optimizer will generate an execute plan by sniffing the value of the @NameLike parameter. The execution plan is then reused by others queries with no issues (predicate pattern is pretty the same). However after clearing the plan cache (at this point we just want to simulate a plan cache invalidation), the fourth query will produce a different execution plan (predicate is not the same than previous queries). Re-executing the first three queries gives degraded results this time as you can notice below:
Let’s have a look at the new query store feature and the regressed queries report.
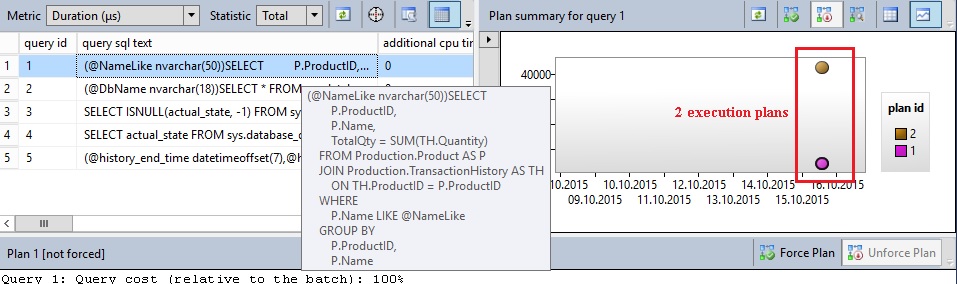
I can find out my prepared query (in parametrized format) at the section on the left and an execution timeline that includes the two related execution plans and the deviation as well.
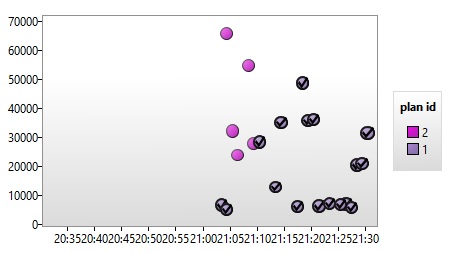
Let’s switch to another query store report “Top resource consumers during the last hour”:
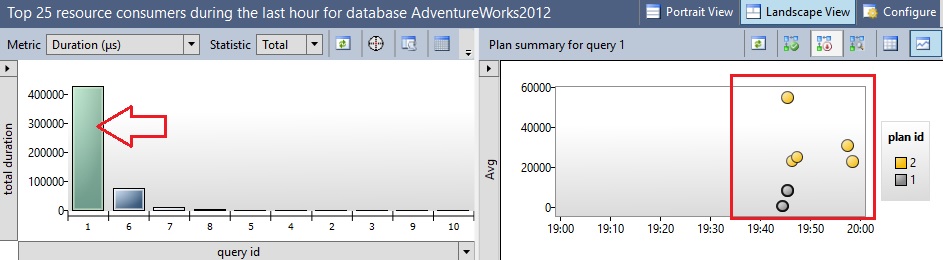
You can notice on the right the different query occurrences that I ran during the test, their execution statistics as well as their related execution plans. We can clearly notice that the second plan execution generated by my fourth query has introduced some degradation for all the others.
A cool thing you can do with the query store in this case is to compare the both execution plans in order to investigate where the degradation comes from:
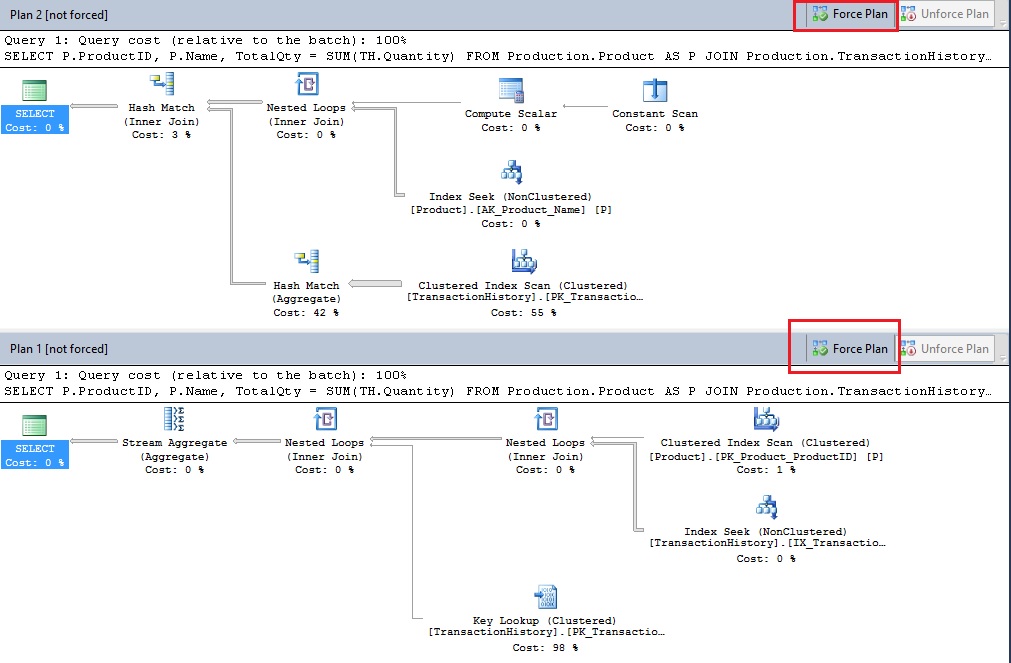
In my case, the problem is pretty obvious. The second plan generated uses a clustered index scan operation for the TransactionHistory table compared to the first query plan that used an index seek.
The magic stuff here is you are able to fix the problem by forcing an execution plan. When you force a plan, SQL Server will transparently use the USE PLAN command with no database administration intervention. Let’s force the first query plan in my case and let’s take a look again at the execution statistic chart:
After forcing the plan we can notice that aggregated execution time of all the queries are lower with the forced plan compared to the second plan generated previously. After excluding the fourth query from my test script, the execution time dropped again to the same value than the first queries execution. Finally, I included again the fourth query in my script and the aggregated execution time value increased but with a different order of magnitude.
You may probably wonder what’s going on if the execution plan is invalidated. Well, it doesn’t matter and the next generated plan will be forced by the query store. However I noticed that the new plan is not tagged as forced as shown below. The new plan (plan id = 10) has been generated after I cleared the SQL Server cache and the new one is similar to the previous forced plan as expected.
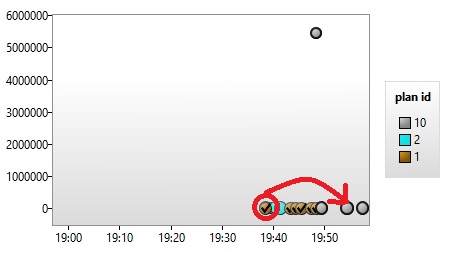
I can understand such situation because this is a new execution plan but I didn’t find any direct correlation with the old forced one. In my opinion, it could be disappointing because over the time database administrators may not be aware that the plan is already forced. I will update this blog post if I get some clues from Microsoft.
So far what we’ve learned about “Query Store”:
It collects all query execution plans along with their statistics and visually presents it with pretty friendly interface. We can force specific plan to be executed for a query (good bye plan guides? certainly …).
Describing all the possibilities provided by the query store in one blog post is not possible. So, some others will follow….
See you
By David Barbarin
![Thumbnail [60x60]](https://www.dbi-services.com/blog/wp-content/uploads/2022/12/microsoft-square.png)
![Thumbnail [90x90]](https://www.dbi-services.com/blog/wp-content/uploads/2022/08/DWE_web-min-scaled.jpg)