By Franck Pachot
.

My last post came from a discussion at SITB with exoscale. They are doing Cloud hosting with datacenters in Switzerland. In Switzerland a lot of companies cannot host their data outside of the country, which is a no-go for the big Cloud providers.
After the discussion they gave me a coupon for a trial IaaS instance.
And if you follow my blog you should know that when I have a trial access, there are good chances that I try it…
The provisioning interface is really simple: You choose the datacenter (I choose the one near Zurich, in a disused military bunker) and a VM with 2 vCPU and 2GB RAM.
I want to install Oracle Database. I choose Linux CentOS. I’ll probably try CoreOS later if I’ve some credits remaining.
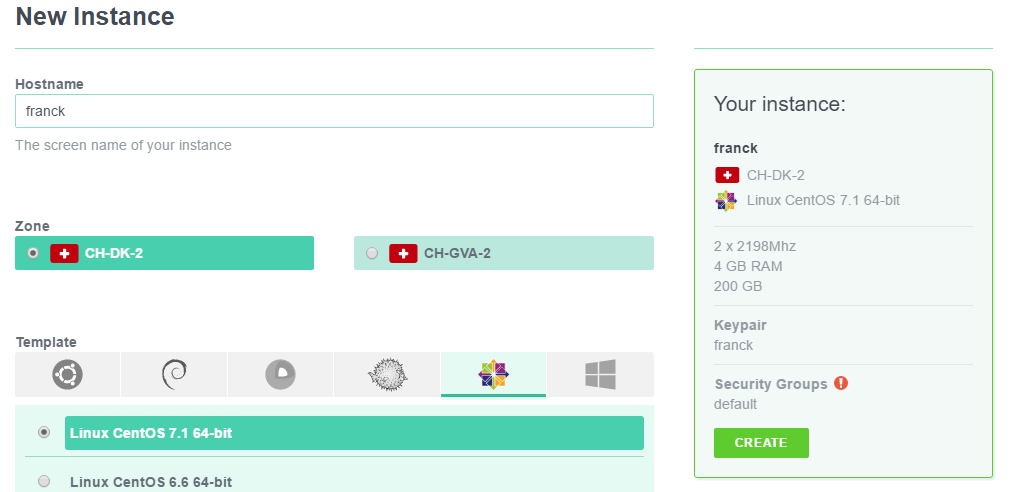
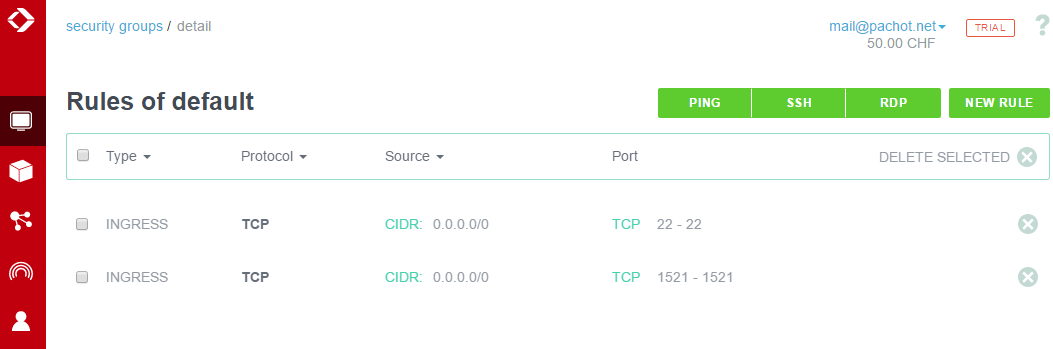
I’ll have to connect to it so I open the ssh port, which is done with a simple clic, and I add the listener port as my goal is to run SLOB on an Oracle Database and monitor performance with Orachrome Lighty – all components of my favorite ecosystem…
I don’t like passwords so I import my ssh public key:
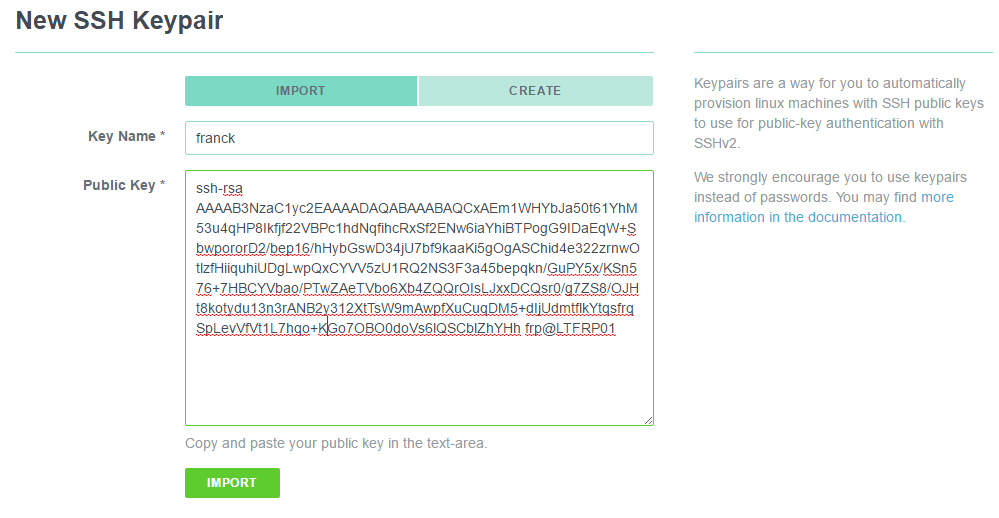
and the system is ready in few seconds:
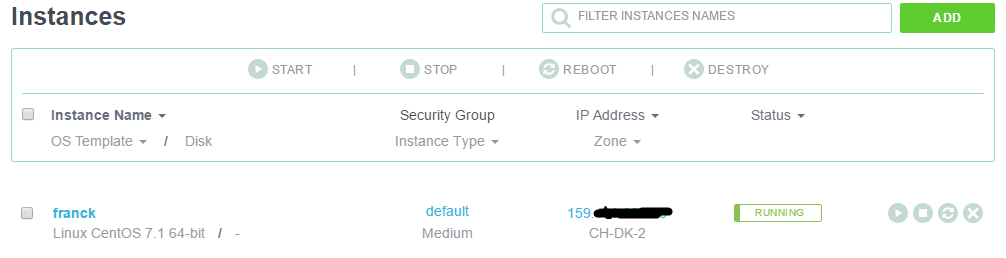
Now I can connect with ssh on the ip address provided, as root, and set the system for Oracle Database:
[root@franck ~]# groupadd oinstall
[root@franck ~]# groupadd dba
[root@franck ~]# useradd -g oinstall -G dba oracle
[root@franck ~]# passwd oracle
I put my public ssh key into oracle authorized_keys. I set the kernel settings. I upload the 12c binaries and ready to install.
I install SLOB (https://kevinclosson.net/slob/), useing the create database kit and run the default PIO workload:
UPDATE_PCT: 25
RUN_TIME: 3600000
WORK_LOOP: 10000000
SCALE: 100M (12800 blocks)
WORK_UNIT: 64
REDO_STRESS: LITE
HOT_SCHEMA_FREQUENCY: 0
DO_HOTSPOT: FALSE
HOTSPOT_MB: 8
HOTSPOT_OFFSET_MB: 16
HOTSPOT_FREQUENCY: 3
THINK_TM_FREQUENCY: 0
THINK_TM_MIN: .1
THINK_TM_MAX: .5
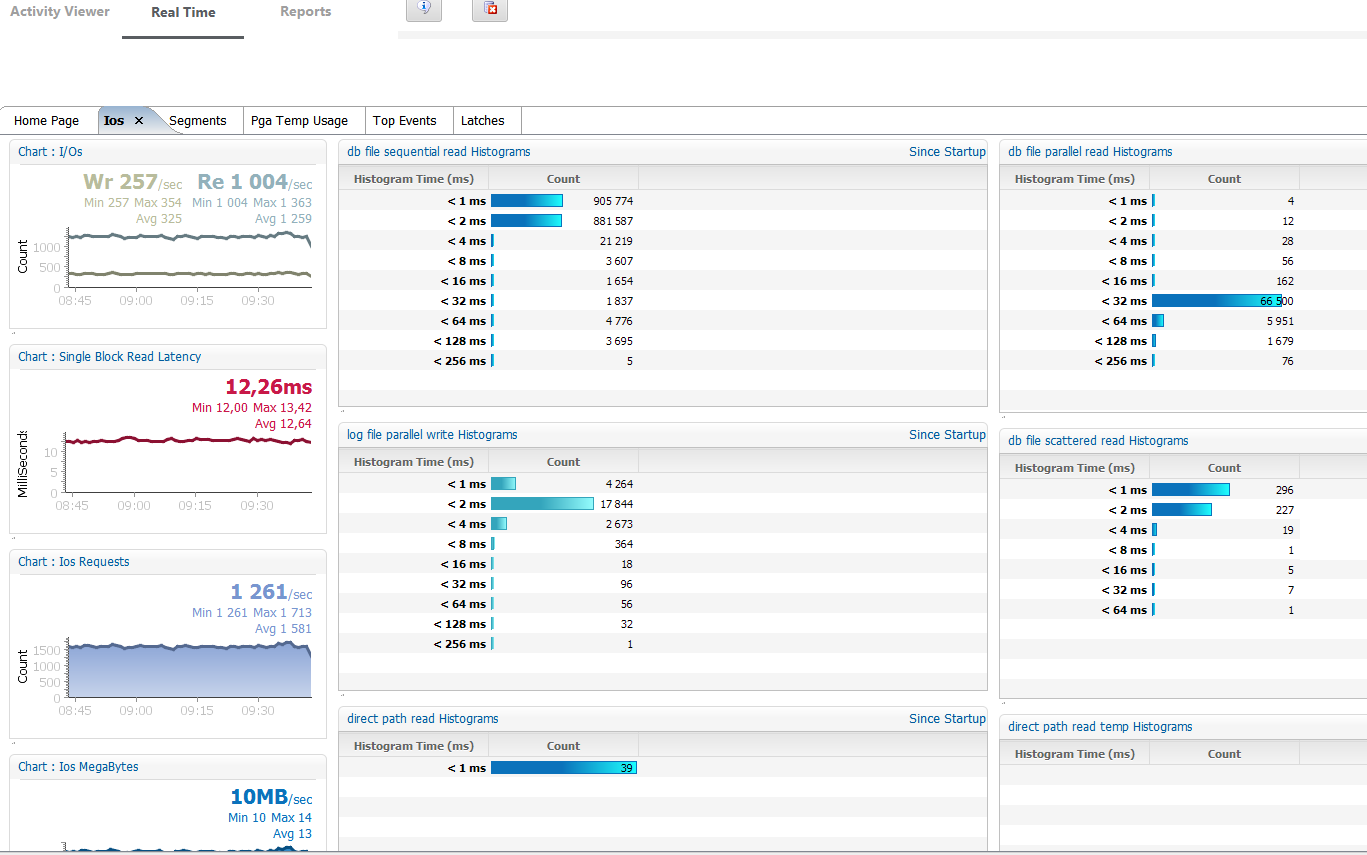
Result: 1500 IOPS with latency in few milliseconds for 8k reads.
Load Profile                    Per Second   Per Transaction  Per Exec  Per Call
~~~~~~~~~~~~~~~            ---------------   --------------- --------- ---------
             DB Time(s):               1.0               0.2      0.05      3.89
              DB CPU(s):               0.1               0.0      0.00      0.39
      Background CPU(s):               0.0               0.0      0.00      0.00
      Redo size (bytes):         255,885.4          51,476.9
  Logical read (blocks):           1,375.2             276.7
          Block changes:             652.0             131.2
 Physical read (blocks):           1,261.9             253.9
Physical write (blocks):             324.1              65.2
       Read IO requests:           1,261.7             253.8
      Write IO requests:             310.8              62.5
           Read IO (MB):               9.9               2.0
          Write IO (MB):               2.5               0.5
Wait events (I don’t know why the sum is above 100%…)
Top 10 Foreground Events by Total Wait Time
~~~~~~~~~~~~~~~~~~~~~~~~~~~~~~~~~~~~~~~~~~~
                                           Total Wait       Wait   % DB Wait
Event                                Waits Time (sec)    Avg(ms)   time Class
------------------------------ ----------- ---------- ---------- ------ --------
db file sequential read          1,826,324     2442.5       1.34   48.2 User I/O
db file parallel read               74,983     2285.2      30.48   45.1 User I/O
DB CPU                                          509.2              10.0
And wait event histogram in microseconds for single block reads:
EVENT                          WAIT_TIME_MICRO WAIT_COUNT WAIT_TIME_FORMAT
------------------------------ --------------- ---------- ------------------------------
db file sequential read                      1          0 1 microsecond
db file sequential read                      2          0 2 microseconds
db file sequential read                      4          0 4 microseconds
db file sequential read                      8          0 8 microseconds
db file sequential read                     16          0 16 microseconds
db file sequential read                     32          0 32 microseconds
db file sequential read                     64          0 64 microseconds
db file sequential read                    128        191 128 microseconds
db file sequential read                    256       3639 256 microseconds
db file sequential read                    512      71489 512 microseconds
db file sequential read                   1024     838371 1 millisecond
db file sequential read                   2048     887138 2 milliseconds
db file sequential read                   4096      21358 4 milliseconds
db file sequential read                   8192       3625 8 milliseconds
db file sequential read                  16384       1659 16 milliseconds
db file sequential read                  32768       1863 32 milliseconds
db file sequential read                  65536       4817 65 milliseconds
db file sequential read                 131072       3721 131 milliseconds
db file sequential read                 262144          5 262 milliseconds
Now time to look at CPU. The processors are not the latest Intel generation:
Model name:            Intel Xeon E312xx (Sandy Bridge)
CPU MHz:               2593.748
I’ve run same slob.conf except that I reduce the scal to fit in buffer cache and do no updates
Load Profile                    Per Second   Per Transaction  Per Exec  Per Call
~~~~~~~~~~~~~~~            ---------------   --------------- --------- ---------
             DB Time(s):               0.8               2.1      0.00      0.66
              DB CPU(s):               0.8               2.0      0.00      0.65
      Background CPU(s):               0.0               0.0      0.00      0.00
      Redo size (bytes):           8,257.2          20,944.9
  Logical read (blocks):         411,781.5       1,044,502.5
          Block changes:              41.8             106.1
 Physical read (blocks):              10.9              27.7
Physical write (blocks):               3.5               8.9
       Read IO requests:               9.9              25.2
      Write IO requests:               2.7               6.7
That’s 412000 logical reads per seconds per CPU. However I’ve only 0.8 CPU here.
I nearly forgot the great feature of 12c AWR report: the active-html with it’s ‘tetris’ view. Here it is:
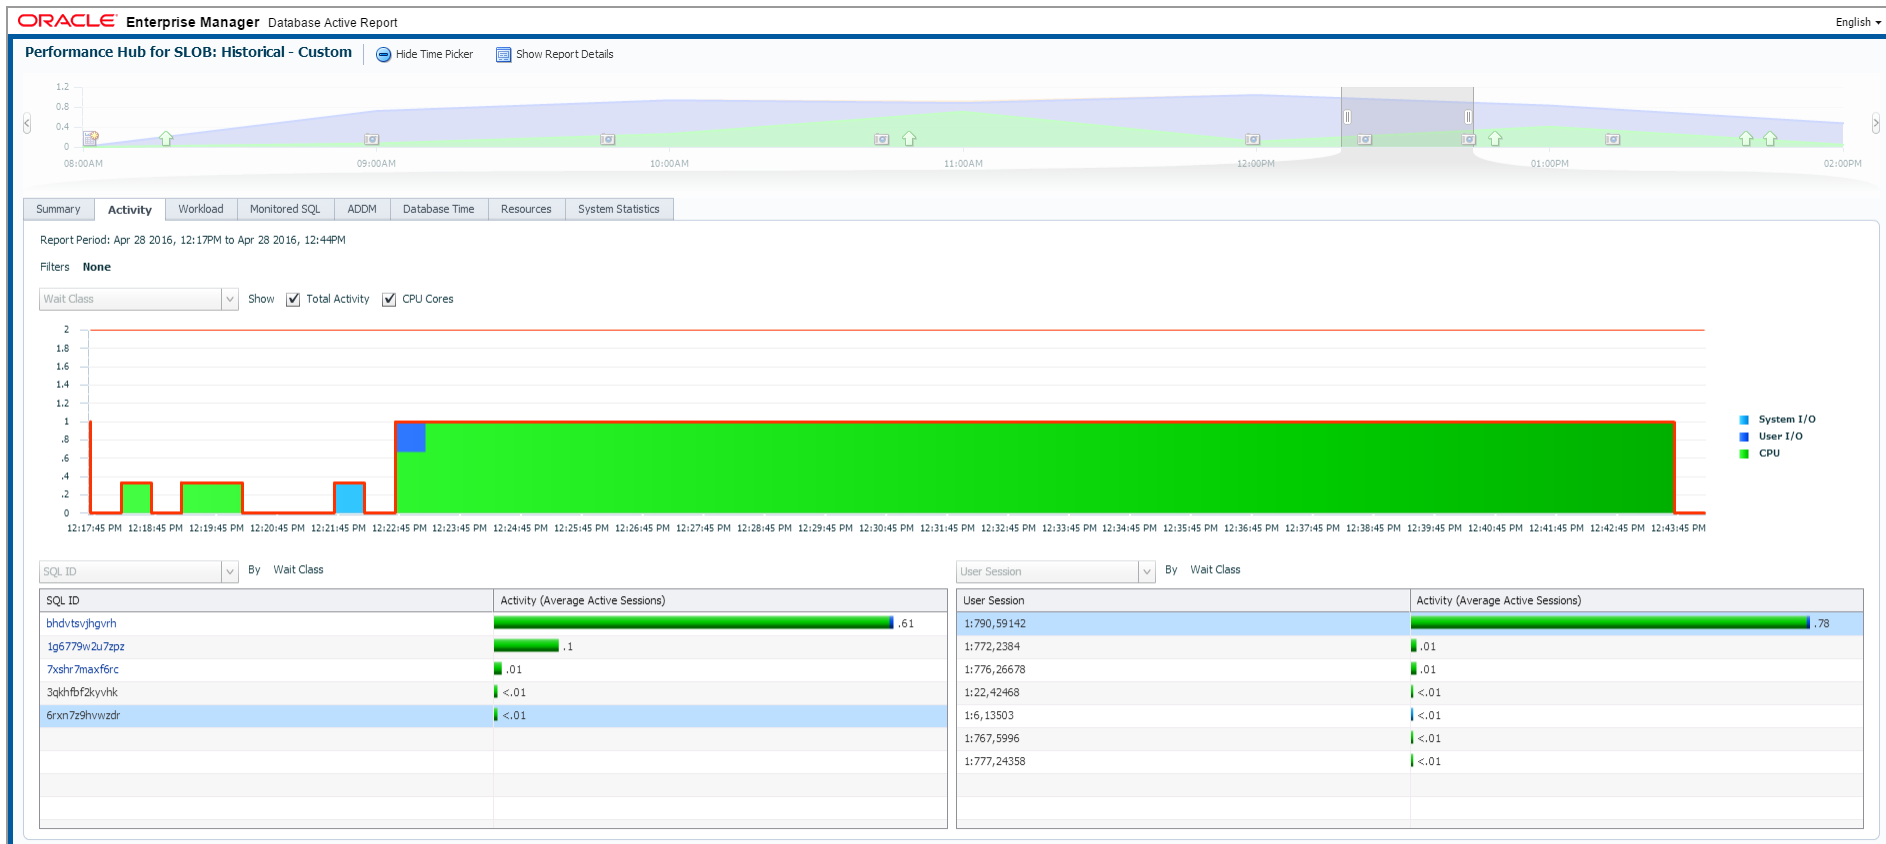
Ok it seems I had a little delay at the beginning of the run before it was 100% in CPU. Knowing that, I run a report on a shorter period:
Load Profile                    Per Second   Per Transaction  Per Exec  Per Call
~~~~~~~~~~~~~~~            ---------------   --------------- --------- ---------
             DB Time(s):               1.0               2.1      0.00      2.81
              DB CPU(s):               1.0               2.1      0.00      2.79
      Background CPU(s):               0.0               0.0      0.00      0.00
      Redo size (bytes):           8,518.5          18,255.4
  Logical read (blocks):         518,770.0       1,111,743.4
          Block changes:              41.0              87.9
 Physical read (blocks):              11.8              25.3
Physical write (blocks):               1.2               2.6
       Read IO requests:              11.5              24.7
Here are the numbers then. Up to 520000 logical reads per second per CPU.
That’s not extreme performance, but it’s an acceptable alternative to on-premises physical server. Provisioning is really easy.
Update April 29th, 2016
I realize that the last sentence may be misleading. Actually the performance is not bad at all. I was just comparing with the same tests I did on Oracle Cloud Services where I hit the storage head cache most of the time. The IOPS may need further tests. However the following workload with intensive updates (large buffer cache, PCT_UPDATE=25%) is not bad at all:
Load Profile                    Per Second   Per Transaction  Per Exec  Per Call
~~~~~~~~~~~~~~~            ---------------   --------------- --------- ---------
             DB Time(s):               1.0               0.0      0.00      4.17
              DB CPU(s):               0.9               0.0      0.00      3.88
      Background CPU(s):               0.1               0.0      0.00      0.00
      Redo size (bytes):      38,568,625.6          51,953.1
  Logical read (blocks):         202,771.0             273.1
          Block changes:          97,125.0             130.8
 Physical read (blocks):               4.5               0.0
Physical write (blocks):           2,316.2               3.1
         Executes (SQL):           2,971.5               4.0
              Rollbacks:               0.0               0.0
           Transactions:             742.4
The CPU (according to Kevin Closson) is ok:
https://twitter.com/kevinclosson/status/725798295239561219
![Thumbnail [60x60]](https://www.dbi-services.com/blog/wp-content/uploads/2022/12/oracle-square.png)
![Thumbnail [90x90]](https://www.dbi-services.com/blog/wp-content/uploads/2022/08/DWE_web-min-scaled.jpg)