log_duration is a useful point for finding slow running queries and to find performance issues also on the applications side using PostgreSQL as database. Another topic is finding issues with Java Applications using Hibernate after a migration to PostgreSQL. Often Hibernate switches from lazy to eager mode and this has massive impact on the application performance.
In this context I will also describe one of the most useful extensions: pg_stat_statements.
The log duration shown in the logs of PostgreSQL includes the client time, so if you have slow queries it can be also issued by network problems.
For demonstaration I will start with creating my own database:
postgres=# create database blog_log_duration;
After creating the database we leave psql with “\q” and with psql log_log_duration as the default; we connect to our newly created database. The parameter log_duration will switch on logging of the duration for everything and than log_min_duration_statement will show the queries when exeeding the specified runtime.
So both paramters settings, log_duration to on and log_min_duration_statement with a value will fill up the logfile, it makes no sense, so we use log_min_duration_statement only.
postgres=# alter system set log_min_duration_statement = 10000;
ALTER SYSTEM
As an example to log queries runing longer than 10s, the parameter setting is in ms.
postgres=# select pg_reload_conf();
pg_reload_conf
----------------
t
(1 row)

postgres=#
The new setting becomes active as global setting for all databases on this instance. Quitting the postgres connection with “\q” and connecting to our newly created database with:
psql blog_log_duration;

postgres=#select pg_sleep(11);
In the log file we will see the following:
LOG: duration: 11032.666 ms statement: select pg_sleep(11);
Another possibility is to change these settings for one specific database only, for this we need to revoke the global setting with:
postgres=# alter system reset log_min_duration_statement;
ALTER SYSTEM
And reloading the configuration with:
postgres=# select pg_reload_conf();
pg_reload_conf
----------------
t
(1 row)
Checking with:
postgres=# select pg_sleep(11);
… shows no new entry in the log file.
Now we can change this parameter for our test database we created at the beginning:
postgres=# alter database blog_log_duration set log_min_duration_statement = 5000;
Checking for the postgres database:
postgres=# select pg_sleep(11);
… shows again no new entry in the log file.
Settings on database level overruling global settings, just as notice.
Disconnecting from the postgres database with:
postgres=# \q
Connecting to the blog_log_duration database with:
psql blog_log_duration
And checking here with:
blog_log_duration=# select pg_sleep(6);
pg_sleep
----------

(1 row)

blog_log_duration=#
This results in the following line in the log file:
LOG: duration: 6005.967 ms statement: select pg_sleep(6);
Extension pg_stat_statements
This Extension is one of the most useful, it shows what queries have been sent to the database, how often, average, min and max runtime.
For using pg_stat_statements we need to preload libraries, the required configuration can be done with:
postgres=# alter system set shared_preload_libraries = 'pg_stat_statements';
Than a restart is required, a pg_reload_conf(); is not enough.
Then we connect again to our test database with psql blog_log_duration and create the extension with:
blog_log_duration=# create extension pg_stat_statements;
CREATE EXTENSION
blog_log_duration=#

blog_log_duration-# \d pg_stat_statements
View "public.pg_stat_statements"
Column | Type | Collation | Nullable | Default
---------------------+------------------+-----------+----------+---------
userid | oid | | |
dbid | oid | | |
queryid | bigint | | |
query | text | | |
calls | bigint | | |
total_time | double precision | | |
min_time | double precision | | |
max_time | double precision | | |
mean_time | double precision | | |
stddev_time | double precision | | |
rows | bigint | | |
shared_blks_hit | bigint | | |
shared_blks_read | bigint | | |
shared_blks_dirtied | bigint | | |
shared_blks_written | bigint | | |
local_blks_hit | bigint | | |
local_blks_read | bigint | | |
local_blks_dirtied | bigint | | |
local_blks_written | bigint | | |
temp_blks_read | bigint | | |
temp_blks_written | bigint | | |
blk_read_time | double precision | | |
blk_write_time | double precision | | |

blog_log_duration-# ¨
This gives an overview over the view where we can now get the query informations we want to have. This can become very huge, so there are some parameters that can be set to make it more handable.
- pg_stat_statements.max is setting the maximum number of kept queries in this statistic, 1000 for example means the last 1000 queries kept, 5000 is the default.
- pg_stat_statements.track specifies the queries tracked
- pg_stat_statements.track = all tracks nested statements (including statements invoked within functions), none is disabling statement statistics collection and top is tracing top-level statements (those issued directly by clients), the default value is top.
- pg_stat_statements.save specifies if the statistics are saved across shutdowns or restarts, the default is on.
blog_log_duration=# select pg_stat_statements_reset();
pg_stat_statements_reset
--------------------------

(1 row)

blog_log_duration=#
…is resetting the statistics;
Several runs of select pg_sleep();
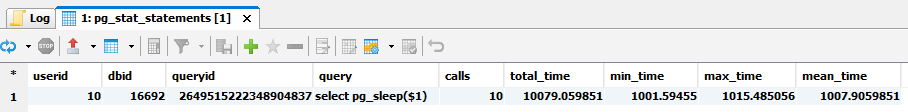
Both informations are very usefull, showing slow queries is one part, how often they used the other one and this defines the priority where to look at first.
![Thumbnail [60x60]](https://www.dbi-services.com/blog/wp-content/uploads/2022/10/KLE_web-min-scaled.jpg)
![Thumbnail [90x90]](https://www.dbi-services.com/blog/wp-content/uploads/2022/08/DWE_web-min-scaled.jpg)