By Franck Pachot
.
If you followed the 1M rows insert variations, you have seen how something simple brought me into an investigation with the latest tools available to see where the time is spent. When the time is CPU time, there is no wait event to get the detail of DB Time. I’ve used perf events in the previous post and I’ll now visualize them with CPU Flame Graph. My goal is to understand why my test cases is 2x longer in 11.2.0.4 vs 11.2.0.3
The idea to use Flame Graphs come from Luca Canali:
.@FranckPachot Franck, have you considered stack profiling and flame graphs? #my2cents /CC @fritshoogland @OracleSK @martinberx
And you can read about Flame Graphs for Oracle on his blog. That was the occasion for me to test that before attending to his presentation at SOUG next week.
perf events and flame graphs
I’ve run my testcase in 11.2.0.3 and 11.2.0.4 and gathered perf events with:
SQL> select spid from v$process
where addr=(select paddr from v$session where sid=sys_context('userenv','sid'));

SPID
------------------------
44658
to get the process id and:
perf record -e cpu-cycles -o /tmp/perf.out -g -c 1 -p 44658
to capture samples. I’ve stopped it after 3 seconds because the high frequency sampling generates large files.
Then I generate flame graphs:
perf script -i /tmp/perf.out | ./FlameGraph-master/stackcollapse-perf.pl > /tmp/perf.folded ; ./FlameGraph-master/flamegraph.pl /tmp/perf.folded > /tmp/perf.folded.svg
1M rows insert test case in 11.2.0.4
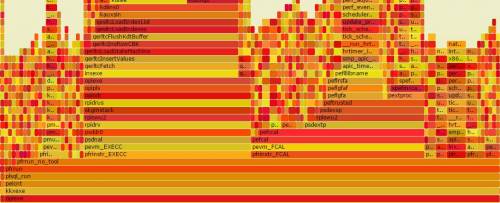
Here is the graph zoomed from opiexe to kdiins0:
I don’t know all the Oracle function names, but I see two call stack with high number of samples. One is related with inserts, index maintenance, etc.
But one is not and here is the call stack:
rpiswu2 psdextp pefccal pefcal pevm_FCAL pfrinstr_FCAL pfrrun_no_tool1M rows insert test case in 11.2.0.3
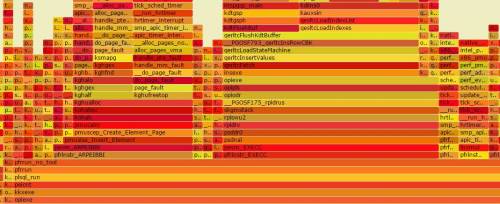
Here is the same but executed on 11.2.0.3
The call stack with ‘rpiswu2 psdextp pefccal pefcal pevm_FCAL pfrinstr_FCAL pfrrun_no_tool’ is not there. I don’t know what are doing those functions but it seems that they are responsible for the additional CPU consumption.
dbms_random
I’m using dbms_random to generate data in my test case. I usually avoid guesses and prefer to go to the root cause only from evidences. But here I don’t know what is behind those functions and my test case is basically doing two things: generate records with random values and insert them into the table. As my CPU utilization seems to be not related to inserts, maybe it’s about the record generation. The idea came first from Sayan Malakshinov on twitter
The testcase I’ve done in https://www.dbi-services.com/index.php/blog/entry/insert1m-bulk … (the bulk one) needs 2x more CPU in >=11.2.0.4 than 11.2.0.2 🙁 pic.twitter.com/EeHJLja4Bh
@FranckPachot Have you checked how much cpu consumed dbms_random.value? It’s quite heavyweight function
8:38 AM – 12 May 2015
and his question reminded me something. Nicolas Jardot presented ‘Solving customer issues with the 12c Optimizer’ at several events and one of his demo compared a testcase between 11g and 12c. The time to generate the testcase was very large in 12c and we already suspected dbms_random. So it’s time to investigate that now. Let’s run the following on both versions:
SQL> declare
   n number;
  begin
   for i in 1..1e8
   loop
    n:=dbms_random.value(0,10000);
   end loop;
  end;
 /

PL/SQL procedure successfully completed.

Elapsed: 00:01:15.88
But when I run it in 11.2.0.4 the time is 4x higher:
PL/SQL procedure successfully completed.

Elapsed: 00:05:31.92
dbms_random loop in 11.2.0.3
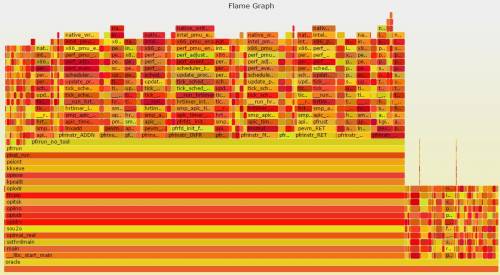
Here is the CPU Flame Graph during the fast execution of the dbms_random loop:
Many functions above pfrrun_no_tool. None with higher samples than others.
dbms_random loop in 11.2.0.4
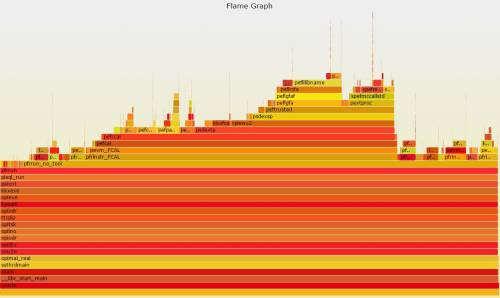
Here is the CPU Flame Graph during the longer execution:
Most of the time is spent in that ‘FCAL’ callstack.
‘diff’ is also a nice tool…
If I had this issue in production, then I would open an SR for a bug. I’ve enough information to give and only Oracle support can go further to see what’s behind those functions. But I’m in a lab and I can go further.
Where is the DBMS_RANDOM defined? Let’s look for it in ORACLE_HOME/rdbms/admin:
$ grep -i "package.*dbms_random" $ORACLE_HOME/rdbms/admin/*
/home/oracle/app/oracle/product/11204/rdbms/admin/dbmsrand.sql:CREATE OR REPLACE PACKAGE dbms_random AUTHID DEFINER AS
/home/oracle/app/oracle/product/11204/rdbms/admin/dbmsrand.sql:CREATE OR REPLACE PACKAGE BODY dbms_random AS
So, what is the difference between the 11.2.0.3 and 11.2.0.4 ?
$ diff /home/oracle/app/oracle/product/1120?/rdbms/admin/dbmsrand.sql
2c2
---
> Rem $Header: rdbms/admin/dbmsrand.sql /st_rdbms_11.2.0/1 2013/03/11 01:24:43 yujwang Exp $
6,7c6,7
---
> Rem Copyright (c) 1997, 2013, Oracle and/or its affiliates.
> Rem All rights reserved.
16a17
> Rem    yberezin    02/26/13 - record and replay random number - bug 12676338
102a104,111
>     -- external C function to record random value
>     PROCEDURE record_random_number(val IN NUMBER);
>     PRAGMA restrict_references (record_random_number, WNDS);
>
>     -- external C function to replay random value
>     FUNCTION replay_random_number RETURN NUMBER;
>     PRAGMA restrict_references (replay_random_number, WNDS);
>
185c194,212
Interesting. There is a new function that is called when generating random numbers, probably to get the same numbers when we replay a RAT workload. This is just a guess, and let’s continue guessing. I’m in a lab I can do what I want. I’m in 11.2.0.4 where by loop takes 5 minutes. I’ll replace the dbms_random with the 11.2.0.3 ones:
sqlplus / as sysdba @ /home/oracle/app/oracle/product/11203/rdbms/admin/dbmsrand.sql

SQL*Plus: Release 11.2.0.4.0 Production on Sun May 17 21:53:50 2015

Copyright (c) 1982, 2013, Oracle.  All rights reserved.

Connected to:
Oracle Database 11g Enterprise Edition Release 11.2.0.4.0 - 64bit Production
With the Partitioning, OLAP, Data Mining and Real Application Testing options

Package created.

Package body created.

Synonym created.

Grant succeeded.
I’m lucky, the old version of the package compiles in my version. Then I run my loop:
PL/SQL procedure successfully completed.

Elapsed: 00:01:10.14
Yes, that’s it. I get the same elapsed time as in 11.2.0.3 just by using the dbms_random from 11.2.0.3
And when I run the testcase from the initial issue – the bulk insert from random values that is 2x faster in versions before 11.2.0.4 or 12c – I have now reduced the time by 2 when using the dbms_random from those previous versions.
Conclusion
I’ve exposed here a methodology that is not exactly what I do usually on a performance issue. I did that because I wanted to learn about those tools (perf events, Flame Graph) I was not yet familiar with. And I also used the old method of eliminating the possible causes one by one: test on same machine, with only the version of Oracle changing, test each part of the code independantly to see where the performance is different, etc.
The final message is: don’t give up. When there is something unexplained, use all relevant tools to measure, use the knowledge you got from your experience. It takes only time, but everything can be explained. And don’t rely only on yourself. There is a very smart community of Oracle fans that can help: blogs, forums, twitter, etc. Here my friends from twitter were a great help, both for ideas (tests, tools, knowledge, ideas) and motivation to continue to investigate.


![Thumbnail [60x60]](https://www.dbi-services.com/blog/wp-content/uploads/2022/12/oracle-square.png)
![Thumbnail [90x90]](https://www.dbi-services.com/blog/wp-content/uploads/2022/08/DWE_web-min-scaled.jpg)
![Thumbnail [90x90]](https://www.dbi-services.com/blog/wp-content/uploads/2022/08/JDU_web-min-scaled.jpg)