When you do not know what the Oracle Trace File Analyzer (tfa) is or you have heard about it but you don’t know what it is for then you probably should read this, especially when you are working in clustered Oracle environments. You know, Oracle loves to create plenty of trace files in various places (yes, this got much better with the Automatic Diagnostics Repository(ADR)). Now imagine you have a cluster and something goes wrong, where do you start? We created a very nice picture for our Grid Infrastructure workshop which gives an idea of all the components and where it can go wrong. Lets start with the components.
This is approximately what you get when you install a three node Oracle RAC infrastructure (I know there are even more when you go for a flex cluster but this is not important for the scope of this post):
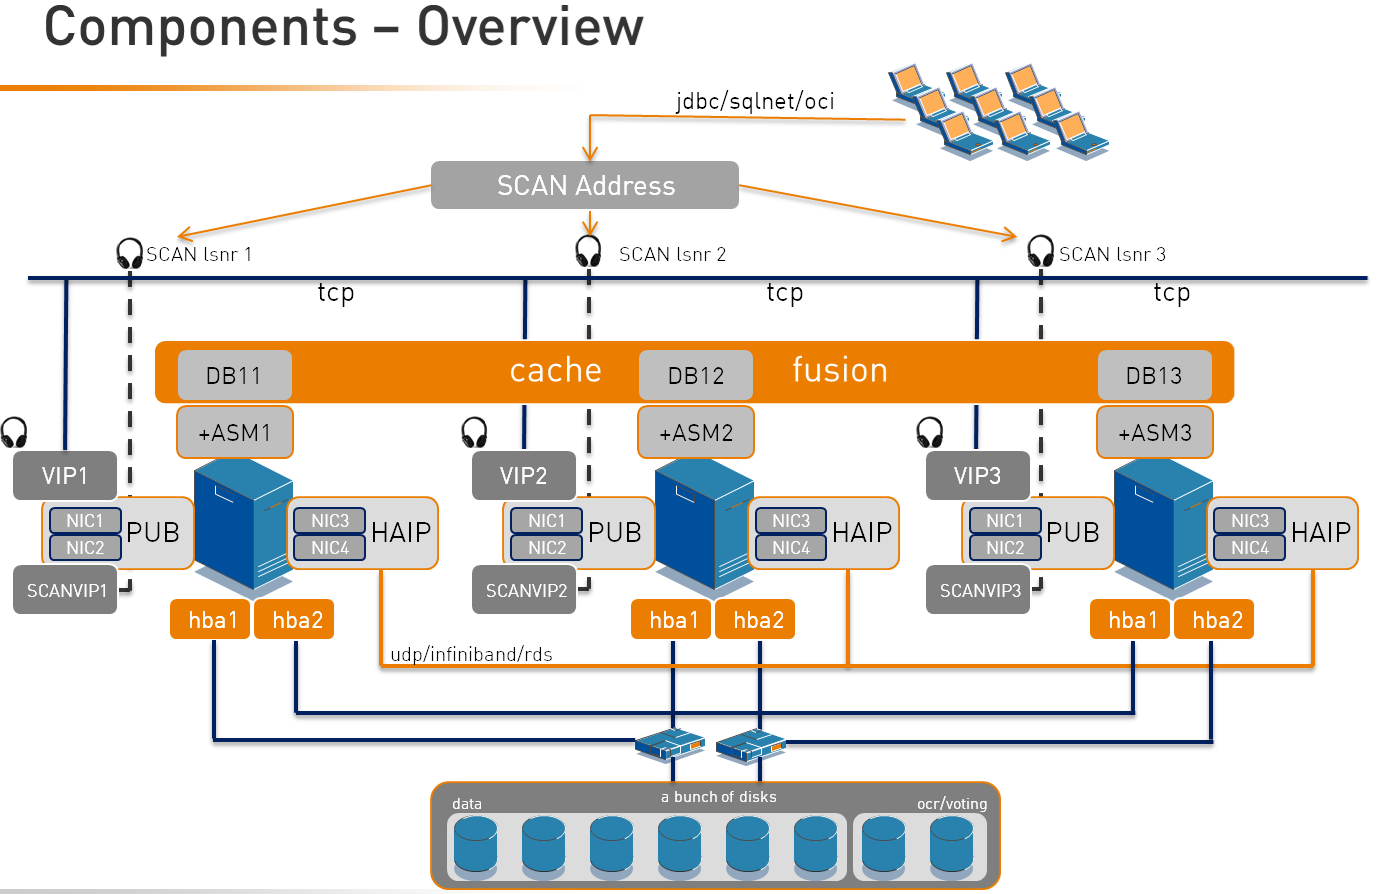
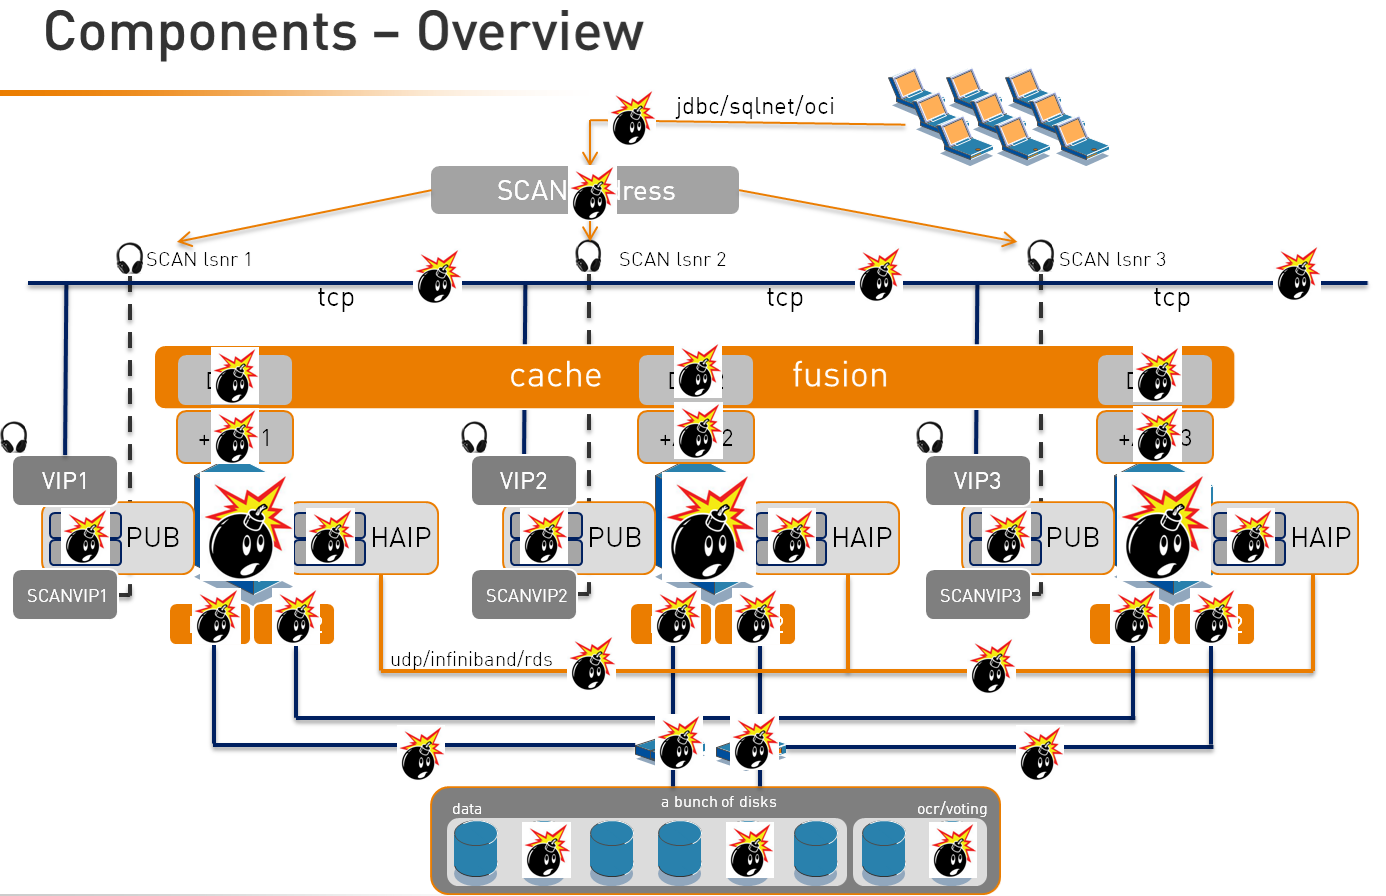
These are quite a few components and all need to work together properly for the cluster being healthy and doing what is expected. And when you have so many components many things can go wrong:
Depending on how good your monitoring is you might know where to start looking for the issue quite fast or you can rely on your experience for starting to troubleshoot. Always a good staring point are the alert logs of the cluster, asm and the database. They all are usually located under $ORACLE_BASE and there are many, many other trace files and directories. For a 12.2 database it looks like this:
oracle@oelrac1:/u01/app/oracle/diag/rdbms/db1/DB1_1/ [DB1_1] ls –la
drwxr-x---.  2 oracle asmadmin    20 Mar 21 14:55 alert
drwxr-x---.  2 oracle asmadmin     6 Mar 21 14:55 cdump
drwxr-x---.  2 oracle asmadmin     6 Mar 21 14:55 hm
drwxr-x---.  2 oracle asmadmin     6 Mar 21 14:55 incident
drwxr-x---.  2 oracle asmadmin     6 Mar 21 14:55 incpkg
drwxr-x---.  2 oracle asmadmin     6 Mar 21 14:55 ir
drwxr-x---.  2 oracle asmadmin  4096 Mar 21 15:00 lck
drwxr-x---.  7 oracle asmadmin    60 Mar 21 14:55 log
drwxr-x---.  2 oracle asmadmin  4096 Mar 21 15:00 metadata
drwxr-x---.  2 oracle asmadmin     6 Mar 21 14:55 metadata_dgif
drwxr-x---.  2 oracle asmadmin     6 Mar 21 14:55 metadata_pv
drwxr-x---.  2 oracle asmadmin     6 Mar 21 14:55 stage
drwxr-x---.  2 oracle asmadmin     6 Mar 21 14:55 sweep
drwxr-x---.  2 oracle asmadmin 36864 May 23 08:26 trace
For a 12.2 Grid Infrastrucure it looks like this:
oracle@oelrac1:/u01/app/oracle/diag/crs/oelrac1/crs/ [DB1_1] ls -la
drwxrwxr-x.  2 oracle oinstall    20 Mar 21 12:59 alert
drwxrwxr-x.  2 oracle oinstall     6 Mar 21 12:59 cdump
drwxrwxr-x.  2 oracle oinstall     6 Mar 21 12:59 incident
drwxrwxr-x.  2 oracle oinstall     6 Mar 21 12:59 incpkg
drwxrwxr-x.  2 oracle oinstall  4096 Mar 21 12:59 lck
drwxrwxr-x.  4 oracle oinstall    29 Mar 21 12:59 log
drwxrwxr-x.  2 oracle oinstall  4096 Mar 21 12:59 metadata
drwxrwxr-x.  2 oracle oinstall     6 Mar 21 12:59 metadata_dgif
drwxrwxr-x.  2 oracle oinstall     6 Mar 21 12:59 metadata_pv
drwxrwxr-x.  2 oracle oinstall     6 Mar 21 12:59 stage
drwxrwxr-x.  2 oracle oinstall     6 Mar 21 12:59 sweep
drwxrwxr-x.  2 oracle oinstall 20480 May 23 08:28 trace
But there are even more when you go one level up:
oracle@oelrac1:/u01/app/oracle/diag/ [DB1_1] ls -la
drwxrwxr-x.  3 oracle oinstall   22 Mar 21 13:02 afdboot
drwxrwxr-x.  2 oracle oinstall    6 Mar 21 12:57 apx
drwxrwxr-x.  5 oracle oinstall   51 Mar 21 13:04 asm
drwxrwxr-x.  4 oracle oinstall   40 Mar 21 13:04 asmtool
drwxrwxr-x.  2 oracle oinstall    6 Mar 21 12:57 bdsql
drwxrwxr-x.  4 oracle oinstall   40 Mar 21 13:05 clients
drwxrwxr-x.  2 oracle oinstall    6 Mar 21 12:57 diagtool
drwxrwxr-x.  2 oracle oinstall    6 Mar 21 12:57 dps
drwxrwxr-x.  2 oracle oinstall    6 Mar 21 12:57 em
drwxrwxr-x.  2 oracle oinstall    6 Mar 21 12:57 gsm
drwxrwxr-x.  2 oracle oinstall    6 Mar 21 12:57 ios
drwxrwxr-x.  2 oracle oinstall    6 Mar 21 12:57 lsnrctl
drwxrwxr-x.  2 oracle oinstall    6 Mar 21 12:57 netcman
drwxrwxr-x.  2 oracle oinstall    6 Mar 21 12:57 ofm
drwxrwxr-x.  2 oracle oinstall    6 Mar 21 12:57 plsql
drwxrwxr-x.  2 oracle oinstall    6 Mar 21 12:57 plsqlapp
drwxrwxr-x.  3 oracle oinstall   20 Mar 21 13:08 tnslsnr
It can quite take some time to locate the trace file which contains the information you need for troubleshooting or for uploading to Oracle support. And this is where the Oracle Trace File Analyzer is a great help. There is a great support note to get started and to download the latest bundle: TFA Collector – TFA with Database Support Tools Bundle (Doc ID 1513912.1).

As the note explains TFA is a bundle of tools. What you get when you download the bundle is this:
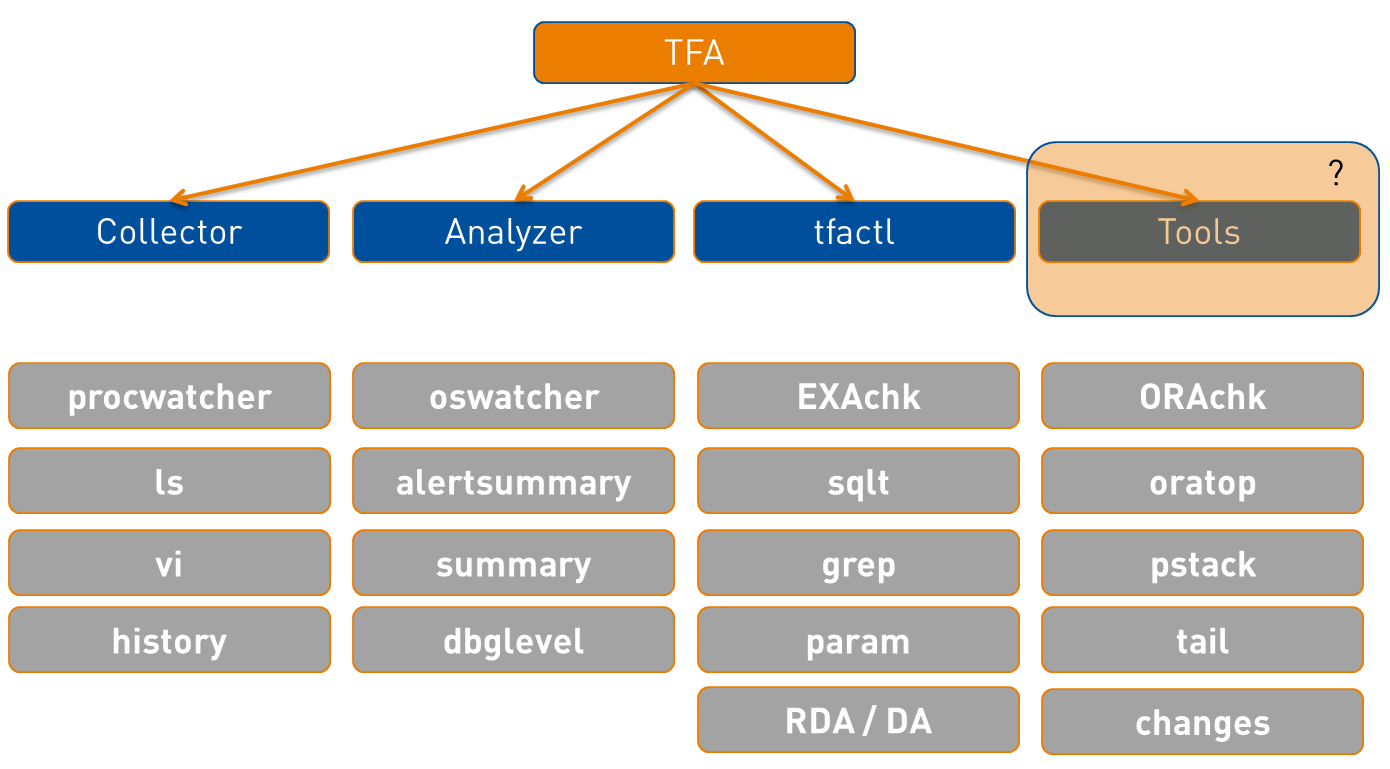
So in words TFA consists of: A collecter, an Analyzer, the tfactl command line utility and a bunch of tools. Probably you already know one or more of these tools and maybe you already installed and used some of them. Stop doing that immediately: Use TFA which brings them all. To come back to the components picture from above: Once you installed TFA the picture looks like this:
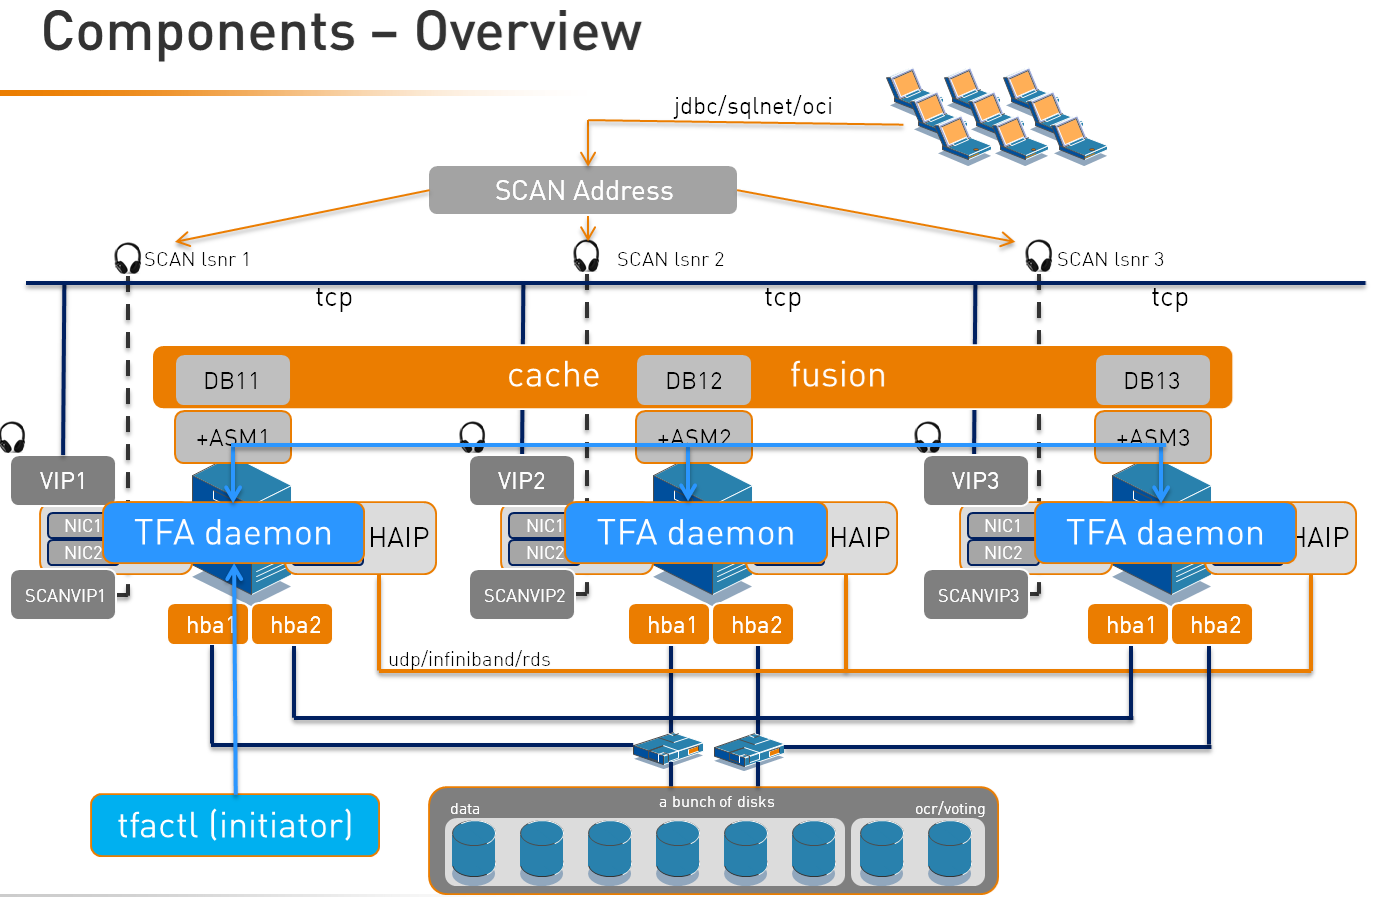
You use tfactl (the initiator) to talk to a local TFA daemon that can talk to the TFA daemons on all other nodes in the cluster. When you install an Oracle 12.2 Grid Infrastructure tfactl is already there:
oracle@oelrac1:/var/tmp/ [+ASM1] which tfactl
/u01/app/12.2.0.1/grid/bin/tfactl
The issue with that is that you do not have all of the support tools available, e.g. you won’t have SQLT, DA/RDA, Procwatcher and OSWatcher. For getting those you’ll need to download the complete bundle from the support note referenced above and then remove the current TFA installation and re-install it:
[root@oelrac1 tmp]$ /u01/app/12.2.0.1/grid/bin/tfactl uninstall
[root@oelrac1 tmp]$ ./installTFALite
Enter a location for installing TFA (/tfa will be appended if not supplied) [/var/tmp/tfa]:
/u01/app/12.2.0.1/grid/tfa
Enter a Java Home that contains Java 1.5 or later : /u01/app/12.2.0.1/grid/jdk/
Once this is through you should see all the tools:
oracle@oelrac1:/home/oracle/ [+ASM1] tfactl toolstatus
.--------------------------------------.
|        External Support Tools        |
+---------+--------------+-------------+
| Host    | Tool         | Status      |
+---------+--------------+-------------+
| oelrac1 | oswbb        | RUNNING     |
| oelrac1 | darda        | DEPLOYED    |
| oelrac1 | prw          | NOT RUNNING |
| oelrac1 | orachk       | DEPLOYED    |
| oelrac1 | vi           | DEPLOYED    |
| oelrac1 | changes      | DEPLOYED    |
| oelrac1 | ps           | DEPLOYED    |
| oelrac1 | param        | DEPLOYED    |
| oelrac1 | events       | DEPLOYED    |
| oelrac1 | alertsummary | DEPLOYED    |
| oelrac1 | ls           | DEPLOYED    |
| oelrac1 | dbperf       | DEPLOYED    |
| oelrac1 | sqlt         | DEPLOYED    |
| oelrac1 | summary      | DEPLOYED    |
| oelrac1 | pstack       | DEPLOYED    |
| oelrac1 | tail         | DEPLOYED    |
| oelrac1 | oratop       | DEPLOYED    |
| oelrac1 | dbglevel     | DEPLOYED    |
| oelrac1 | exachk       | DEPLOYED    |
| oelrac1 | grep         | DEPLOYED    |
| oelrac1 | srdc         | DEPLOYED    |
| oelrac1 | history      | DEPLOYED    |
'---------+--------------+-------------'
I will not go into all the tools but highlight some of them. Lets start with oratop. When you want to know which statements are currently executing in your instance:
oracle@oelrac1:/home/oracle/ [+ASM1] tfactl

tfactl> oratop -database DB1
This bring up something very similar to the “top” command which comes with the operating system but displays information of what is going on in the database:
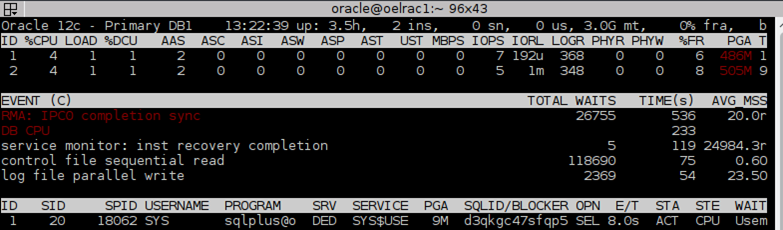
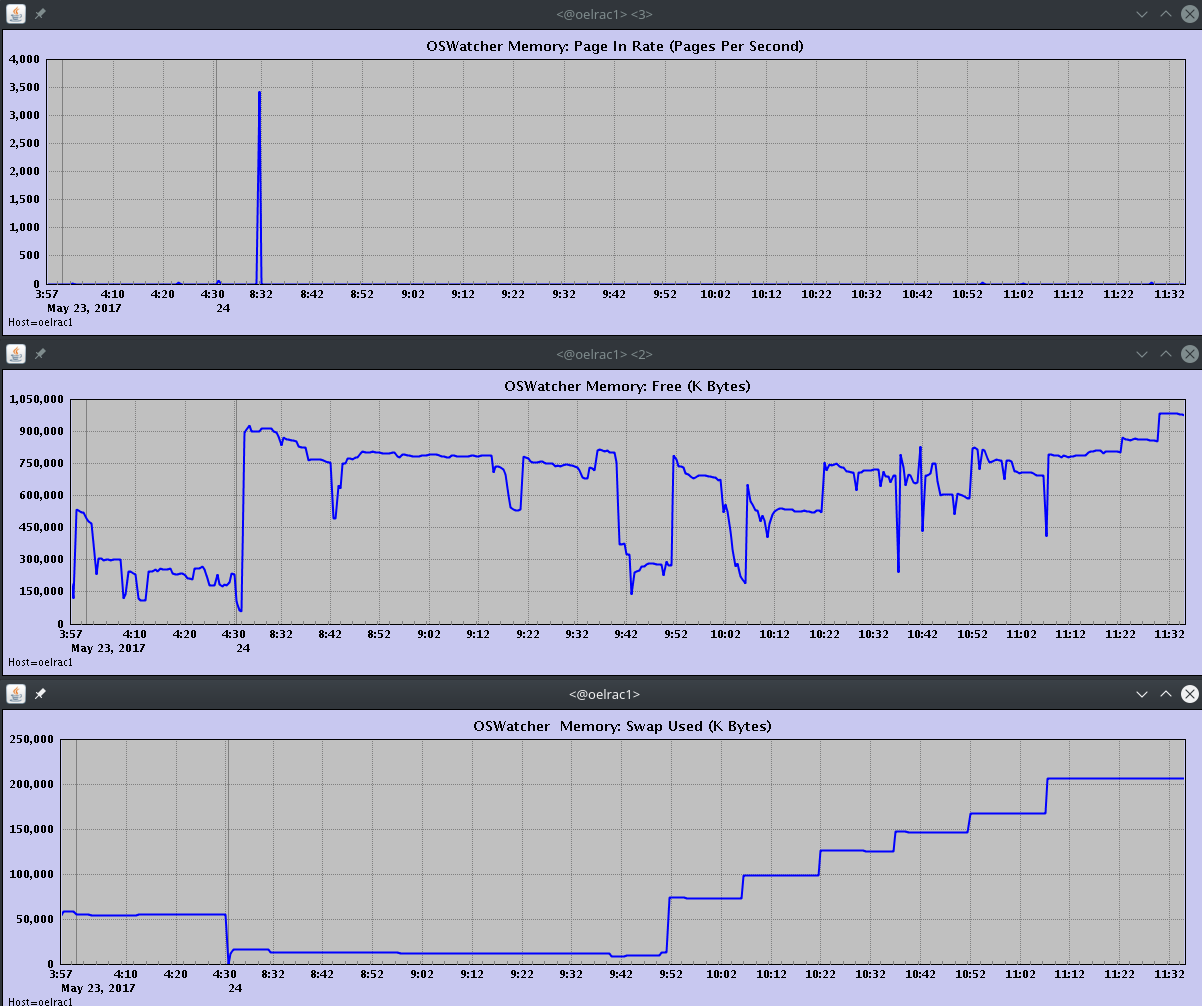
Can be quite handy when you only have access via ssh. Another great tool is OSWatcher which gathers operating statistics in the background and is able to create graphs:
oracle@oelrac1:/home/oracle/ [+ASM1] tfactl run oswbb

Starting OSW Analyzer V7.3.3
OSWatcher Analyzer Written by Oracle Center of Expertise
Copyright (c)  2014 by Oracle Corporation

Parsing Data. Please Wait...

Scanning file headers for version and platform info...


Parsing file oelrac1_iostat_17.05.23.1500.dat ...
Parsing file oelrac1_iostat_17.05.23.1600.dat ...
Parsing file oelrac1_iostat_17.05.24.0800.dat ...
Parsing file oelrac1_iostat_17.05.24.0900.dat ...
Parsing file oelrac1_iostat_17.05.24.1000.dat ...
Parsing file oelrac1_iostat_17.05.24.1100.dat ...


Parsing file oelrac1_vmstat_17.05.23.1500.dat ...
Parsing file oelrac1_vmstat_17.05.23.1600.dat ...
Parsing file oelrac1_vmstat_17.05.24.0800.dat ...
Parsing file oelrac1_vmstat_17.05.24.0900.dat ...
Parsing file oelrac1_vmstat_17.05.24.1000.dat ...
Parsing file oelrac1_vmstat_17.05.24.1100.dat ...


Parsing file oelrac1_netstat_17.05.23.1500.dat ...
Parsing file oelrac1_netstat_17.05.23.1600.dat ...
Parsing file oelrac1_netstat_17.05.24.0800.dat ...
Parsing file oelrac1_netstat_17.05.24.0900.dat ...
Parsing file oelrac1_netstat_17.05.24.1000.dat ...
Parsing file oelrac1_netstat_17.05.24.1100.dat ...


Parsing file oelrac1_top_17.05.23.1500.dat ...
Parsing file oelrac1_top_17.05.23.1600.dat ...
Parsing file oelrac1_top_17.05.24.0800.dat ...
Parsing file oelrac1_top_17.05.24.0900.dat ...
Parsing file oelrac1_top_17.05.24.1000.dat ...
Parsing file oelrac1_top_17.05.24.1100.dat ...


Parsing file oelrac1_ps_17.05.23.1500.dat ...
Parsing file oelrac1_ps_17.05.23.1600.dat ...
Parsing file oelrac1_ps_17.05.24.0800.dat ...
Parsing file oelrac1_ps_17.05.24.0900.dat ...
Parsing file oelrac1_ps_17.05.24.1000.dat ...
Parsing file oelrac1_ps_17.05.24.1100.dat ...


Parsing Completed.


Enter 1 to Display CPU Process Queue Graphs
Enter 2 to Display CPU Utilization Graphs
Enter 3 to Display CPU Other Graphs
Enter 4 to Display Memory Graphs
Enter 5 to Display Disk IO Graphs

Enter 6 to Generate All CPU Gif Files
Enter 7 to Generate All Memory Gif Files
Enter 8 to Generate All Disk Gif Files

Enter L to Specify Alternate Location of Gif Directory
Enter T to Alter Graph Time Scale Only (Does not change analysis dataset)
Enter D to Return to Default Graph Time Scale
Enter R to Remove Currently Displayed Graphs

Enter A to Analyze Data
Enter S to Analyze Subset of Data(Changes analysis dataset including graph time scale)

Enter P to Generate A Profile
Enter X to Export Parsed Data to File
Enter Q to Quit Program

Please Select an Option:4
When you for example chose “4 Display Memory Graphs” this will bring up nice graphs about the memory consumption:
Very handy as well. But what do you do when you have a seriou issues and need to collect all the trace/log files? Quite easy as well, lets do a short demo and force an ORA-07445:
oracle@oelrac1:/home/oracle/ [+ASM1] kill -l | grep SIGSEGV
11) SIGSEGV	12) SIGUSR2	13) SIGPIPE	14) SIGALRM	15) SIGTERM
oracle@oelrac1:/home/oracle/ [+ASM1] ps -ef | grep dbw  | grep DB1
oracle   14821     1  0 08:20 ?        00:00:00 ora_dbw0_DB1_1
oracle@oelrac1:/home/oracle/ [+ASM1] kill -11 14821
This will cause the database to restart, so please don’t do this on other systems than your lab systems. What we can do now is to ask TFA to collect all the files from all nodes which are required for troubleshooting the issue:
oracle@oelrac1:/home/oracle/ [+ASM1] tfactl diagcollect -srdc ora7445
Enter the time of the ORA-07445 [YYYY-MM-DD HH24:MI:SS,=ALL] :
Enter the Database Name [=ALL] : DB1

1. May/24/2017 09:39:52 : [db1] ORA-07445: exception encountered: core dump [semtimedop()+10] [SIGSEGV] [ADDR:0xD43100006015] [PC:0x7F746C15DFCA] [unknown code] []

Please choose the event : 1-1 [1] 1
…
Logs are being collected to: /u01/app/oracle/tfa/repository/srdc_ora7445_collection_Wed_May_24_09_43_07_CEST_2017_node_local
/u01/app/oracle/tfa/repository/srdc_ora7445_collection_Wed_May_24_09_43_07_CEST_2017_node_local/oelrac1.tfa_srdc_ora7445_Wed_May_24_09_43_07_CEST_2017.zip
Get the zip file and either start to analyze yourself or upload to Oracle Support. Usually they should not ask you for additional log or trace files anymore 🙂 Saves a lot of time.
If you prefer a menu driven interface to all the tools you can have that as well:
oracle@oelrac1:/home/oracle/ [+ASM1] tfactl run darda
This will bring up a menu similar to a Linux text based installation program:
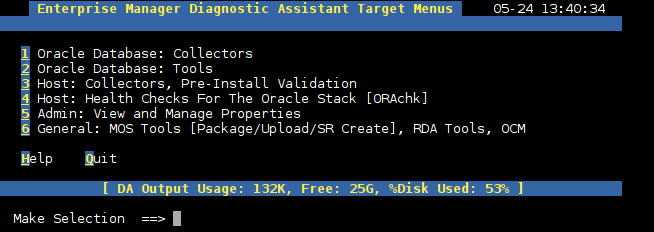
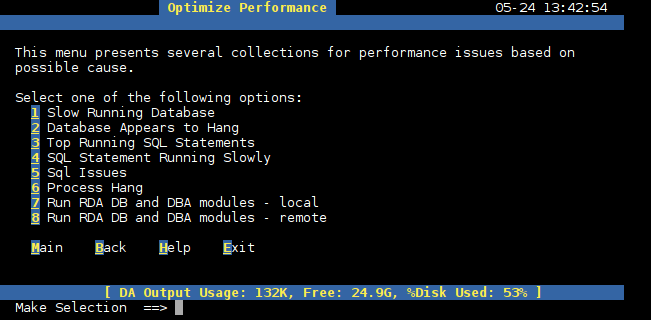
Chose what you want to do, e.g. “1” for “Oracle Database: Collectors”:
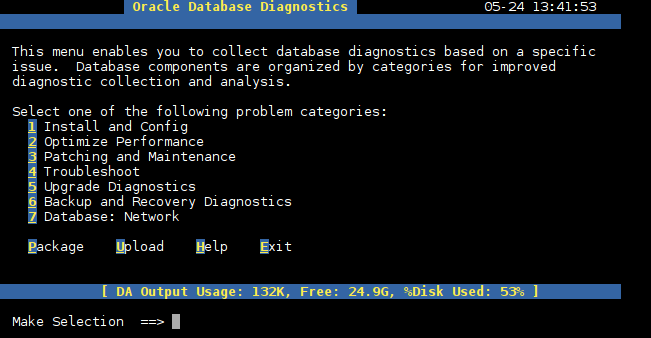
Go to “2 Optimize Performance”:
You have a “1 Slow Running Database”, so:
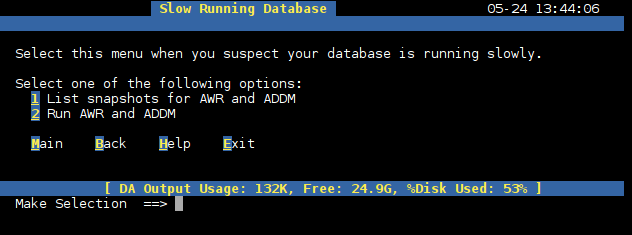
… and you have the possibility to run an AWR report from here. Of course you should monitor that TFA is running so that you get notified when things like this happen:
oracle@oelrac1:/home/oracle/ [+ASM1] sudo $ORACLE_HOME/bin/tfactl status

.----------------------------------------------------------------------------------------------.
| Host    | Status of TFA | PID  | Port | Version    | Build ID             | Inventory Status |
+---------+---------------+------+------+------------+----------------------+------------------+
| oelrac1 | RUNNING       | 2532 | 5000 | 12.1.2.8.4 | 12128420170206111019 | COMPLETE         |
| oelrac2 | NOT RUNNING   | -    |      |            |                      |                  |
'---------+---------------+------+------+------------+----------------------+------------------'
There is much more you can do with tfa (check the documentation) and tfa is useful for single instances as well. Hope this helps ….
![Thumbnail [60x60]](https://www.dbi-services.com/blog/wp-content/uploads/2022/08/DWE_web-min-scaled.jpg)